


Woking Borough Council elections
One third of Woking Borough Council in Surrey, England is elected each year, followed by one year without election. Since the last boundary changes in 2016, 30 councillors have been elected from 10 wards.[1]
Political control
A borough called Woking had existed since 1974 and was controlled by the Conservative Party until the local elections in 1986. The partisan control of the borough has been as follows, with each poll electing one third of the seats, except where noted.[2][3]
| Year | Conservative | Labour | Liberal Democrats[a] | Independents & Others |
Council control after election | |||
|---|---|---|---|---|---|---|---|---|
| Local government reorganisation; council established (32 seats) | ||||||||
| 1973 | 19 | 12 | 1 | 0 | Conservative | |||
| New ward boundaries (35 seats) | ||||||||
| 1976 | 27 | 8 | 0 | 0 | Conservative | |||
| 1978 | 27 | 8 | 0 | 0 | Conservative | |||
| 1979 | 27 | 8 | 0 | 0 | Conservative | |||
| 1980 | 25 | 9 | 1 | 0 | Conservative | |||
| 1982 | 24 | 7 | 4 | 0 | Conservative | |||
| 1983 | 21 | 8 | 6 | 0 | Conservative | |||
| 1984 | 20 | 7 | 8 | 0 | Conservative | |||
| 1986 | 15 | 8 | 12 | 0 | No overall control | |||
| 1987 | 15 | 7 | 13 | 0 | No overall control | |||
| 1988 | 15 | 6 | 14 | 0 | No overall control | |||
| 1990 | 16 | 6 | 13 | 0 | No overall control | |||
| 1991 | 15 | 5 | 14 | 1 | No overall control | |||
| 1992 | 19 | 5 | 11 | 0 | Conservative | |||
| 1994 | 17 | 5 | 13 | 0 | No overall control | |||
| 1995 | 13 | 7 | 14 | 1 | No overall control | |||
| 1996 | 10 | 7 | 18 | 0 | Liberal Democrats | |||
| 1998 | 11 | 7 | 16 | 1 | No overall control | |||
| 1999 | 12 | 7 | 14 | 2[b] | No overall control | |||
| New ward boundaries (36 seats) | ||||||||
| 2000 | 14 | 5 | 16 | 1 | No overall control | |||
| 2002 | 17 | 5 | 13 | 1 | No overall control | |||
| 2003 | 17 | 6 | 12 | 1 | No overall control | |||
| 2004 | 17 | 4 | 15 | 0 | No overall control | |||
| 2006 | 15 | 3 | 18 | 0 | No overall control | |||
| 2007 | 19 | 0 | 17 | 0 | Conservative | |||
| 2008 | 19 | 0 | 17 | 0 | Conservative | |||
| 2010 | 18 | 0 | 17 | 1 | No overall control | |||
| 2011 | 20 | 0 | 16 | 0 | Conservative | |||
| 2012 | 21 | 0 | 15 | 0 | Conservative | |||
| 2014 | 23 | 1 | 11 | 1 | Conservative | |||
| 2015 | 24 | 2 | 9 | 1 | Conservative | |||
| New ward boundaries (30 seats) | ||||||||
| 2016 | 17 | 3 | 7 | 3 | Conservative | |||
| 2018 | 16 | 3 | 8 | 3 | Conservative | |||
| 2019 | 14 | 3 | 10 | 3 | No overall control | |||
| 2021 | 13 | 3 | 12 | 2 | No overall control | |||
| 2022 | 8 | 3 | 16 | 3 | Liberal Democrats | |||
| 2023 | 4 | 3 | 20 | 3 | Liberal Democrats | |||
| 2024 | 0 | 1 | 24 | 5 | Liberal Democrats | |||
| Election | Party in control | Contested | Refs | |
|---|---|---|---|---|
| 2024 | Liberal Democrats | 11 of 30 | [5] | |
| 2023 | Liberal Democrats | 10 of 30 | [6] | |
| 2022 | Liberal Democrats | 10 of 30 | [7] | |
| 2021 | No overall control | 10 of 30 | [8] | |
| 2019 | 10 of 30 | [9][10] | ||
| 2018 | Conservative | 10 of 30 | [11][12] | |
| 2016FW | 30 of 30 | [13][14] | ||
| 2015 | 12 of 36 | [15] | ||
| 2014 | 12 of 36 | [16] | ||
| 2012 | 12 of 36 | [17] | ||
| 2011 | 13 of 36 | [17] | ||
| 2010 | No overall control | 13 of 36 | [17] | |
| 2009* | — | [2] | ||
| 2008 | Conservative | 12 of 36 | [17] | |
| 2007 | 12 of 36 | [17] | ||
| 2006 | No overall control | 13 of 36 | [17] | |
| 2004 | 13 of 36 | [17] | ||
| 2003 | 13 of 36 | [17] | ||
| 2002 | 13 of 36 | [17] | ||
| 2000FW | 36 of 36 | [17][18][19] | ||
| 1999 | 12 of 35 | [17] | ||
| 1998 | 11 of 35 | [17] | ||
| 1996 | Liberal Democrats | 12 of 35 | [17] | |
| 1995 | No overall control | 12 of 35 | [17] | |
| 1994 | 11 of 35 | [17] | ||
| 1992 | Conservative | 12 of 35 | [17] | |
| 1991 | No overall control | 12 of 35 | [17] | |
| 1990 | 12 of 35 | [17] | ||
| 1988 | 15 of 35 | [17] | ||
| 1987 | 12 of 35 | [17] | ||
| 1986B | 12 of 35 | [17][20] | ||
| 1984 | Conservative | 12 of 35 | [17] | |
| 1983 | 13 of 35 | [17] | ||
| 1982 | 11 of 35 | [17] | ||
| 1980 | 12 of 35 | [17] | ||
| 1979B | 12 of 35 | [17][21] | ||
| 1978 | 12 of 35 | [17] | ||
| 1976FW | 35 of 35 | [17][22] | ||
| 1973BF | 34 of 34 | [17] | ||
| B: New borough boundaries F: Full borough election W: New ward boundaries *: Change in control without election | ||||
Borough result maps
-
 2000 results map
 -
 2002 results map
 -
 2003 results map
 -
 2004 results map
 -
 2006 results map
 -
 2007 results map
 -
 2008 results map
 -
 2010 results map
 -
 2011 results map
 -
 2012 results map
 -
 2014 results map
 -
 2015 results map
 -
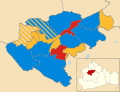
 2016 results map
 -
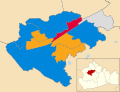
 2018 results map
 -
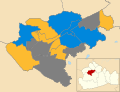
 2019 results map
 -
 2021 results map
 -
 2022 results map
 -
 2023 results map
 -
 2024 results map


By-election results
1994-1998
| Party | Candidate | Votes | % | ±% | |
|---|---|---|---|---|---|
| Liberal Democrats | 927 | 60.6 | |||
| Conservative | 318 | 20.8 | |||
| Labour | 228 | 14.9 | |||
| UKIP | 58 | 3.8 | |||
| Majority | 609 | 39.8 | |||
| Turnout | 1,531 | ||||
| Liberal Democrats hold | Swing | ||||
| Party | Candidate | Votes | % | ±% | |
|---|---|---|---|---|---|
| Liberal Democrats | 626 | 52.2 | +2.4 | ||
| Conservative | 357 | 29.8 | +3.6 | ||
| Labour | 217 | 18.1 | −5.9 | ||
| Majority | 269 | 22.4 | |||
| Turnout | 1,200 | 21.0 | |||
| Liberal Democrats hold | Swing | ||||
| Party | Candidate | Votes | % | ±% | |
|---|---|---|---|---|---|
| Independent | 652 | 34.5 | +34.5 | ||
| Conservative | 545 | 28.9 | −9.0 | ||
| Liberal Democrats | 442 | 23.4 | −16.9 | ||
| Labour | 249 | 13.2 | −8.6 | ||
| Majority | 107 | 5.6 | |||
| Turnout | 1,888 | 24.0 | |||
| Independent gain from Liberal Democrats | Swing | ||||
1998-2002
| Party | Candidate | Votes | % | ±% | |
|---|---|---|---|---|---|
| Conservative | 1,426 | 56.3 | −0.1 | ||
| Liberal Democrats | 942 | 37.2 | +1.3 | ||
| Labour | 164 | 6.5 | −1.3 | ||
| Majority | 484 | 19.1 | |||
| Turnout | 2,532 | 39.9 | |||
| Conservative hold | Swing | ||||
| Party | Candidate | Votes | % | ±% | |
|---|---|---|---|---|---|
| Conservative | Beryl Marlow | 809 | 53.6 | +15.6 | |
| Liberal Democrats | Anne Roberts | 557 | 36.9 | −14.8 | |
| Labour | Raymond Holroyde | 144 | 9.5 | −0.8 | |
| Majority | 252 | 16.7 | |||
| Turnout | 1,510 | 27.5 | |||
| Conservative gain from Liberal Democrats | Swing | ||||
2010-2014
| Party | Candidate | Votes | % | ±% | |
|---|---|---|---|---|---|
| Conservative | Rashid Mohammed | 1,057 | 44.1 | +22.6 | |
| Labour | Stephen Tudhope | 833 | 34.8 | +1.2 | |
| UKIP | Neil Willetts | 255 | 10.6 | −0.2 | |
| Liberal Democrats | Norman Johns | 252 | 10.5 | −23.6 | |
| Majority | 224 | 9.3 | |||
| Turnout | 2,397 | ||||
| Conservative gain from Liberal Democrats | Swing | ||||
2014-2018
| Party | Candidate | Votes | % | ±% | |
|---|---|---|---|---|---|
| Liberal Democrats | James Sanderson | 594 | 37.8 | +13.9 | |
| Conservative | Sonia Elbaraka | 562 | 35.8 | −8.5 | |
| Labour | James Butcher | 262 | 16.7 | −4.6 | |
| UKIP | Tim Read | 154 | 9.8 | −0.7 | |
| Majority | 32 | 2.0 | |||
| Turnout | 1,572 | ||||
| Liberal Democrats hold | Swing | ||||
| Party | Candidate | Votes | % | ±% | |
|---|---|---|---|---|---|
| Conservative | Chitra Rana | 367 | 40.0 | +7.0 | |
| Liberal Democrats | Tina Liddington | 349 | 38.0 | +0.3 | |
| Labour | Robina Shaheen | 105 | 11.4 | +1.2 | |
| UKIP | Troy de Leon | 97 | 10.6 | −8.6 | |
| Majority | 18 | 2.0 | |||
| Turnout | 918 | ||||
| Conservative gain from Liberal Democrats | Swing | ||||
2022-2026
| Party | Candidate | Votes | % | ±% | |
|---|---|---|---|---|---|
| Liberal Democrats | Deborah Hughes | 1,118 | 62.8 | −6.9 | |
| Reform | Sean Flude | 379 | 21.3 | +21.3 | |
| Conservative | Robert Kwiatkowski | 130 | 7.3 | −8.6 | |
| Green | Paul Hoekstra | 83 | 4.7 | +4.7 | |
| Labour | Samar Chaudhary | 69 | 3.9 | −8.2 | |
| Majority | 739 | 41.5 | |||
| Turnout | 1,779 | ||||
| Liberal Democrats hold | Swing | ||||
Notes
- ^ Includes totals for the predecessors of the Liberal Democrats, the Liberal Party and SDP (both of which participated in the Alliance).
- ^ Including 1 vacant seat
References
- ^ "About the Council". Woking Borough Council. Retrieved 4 May 2018.
- ^ a b Woodger, Beth (16 July 2009). "Tory councillor quits party in council debt protest". Get Surrey. Retrieved 12 February 2011.
- ^ "England council elections". BBC News Online. Retrieved 7 September 2011.
- ^ "Composition calculator". Colin Rallings & Michael Thrasher. The Elections Centre, Plymouth University. Retrieved 14 May 2025.
- ^ "Election results 2024: Woking Borough Council". www.bbc.co.uk. Retrieved 4 May 2024.
- ^ "Election results 2023: Woking Borough Council". www.bbc.co.uk. Retrieved 5 May 2023.
- ^ "Election results 2022: Woking Borough Council". www.bbc.co.uk. Retrieved 5 May 2023.
- ^ "Election results 2021: Woking Borough Council". www.woking.gov.uk. 4 May 2021. Retrieved 20 May 2021.
- ^ "Woking Conservative Councillor defects to Lib Dems". Woking Liberal Democrates. 4 April 2019. Retrieved 4 April 2019.
- ^ "Election of Borough Councillors for the Wards of Woking Borough Council Summary of Results" (PDF). Woking Borough Council. Retrieved 2 March 2020.
- ^ "Borough election results, 4 May 2018". Woking Borough Council. 4 May 2018. Retrieved 4 May 2018.
- ^ "Woking Borough Council". BBC News Online. 4 May 2018. Retrieved 4 May 2018.
- ^ "The Woking (Electoral Changes) Order 2015", legislation.gov.uk, The National Archives, SI 2015/1462 Retrieved on 3 November 2015.
- ^ "Past election results". Woking Borough Council. Archived from the original on 7 May 2016. Retrieved 8 May 2016. Cited in 2016 Woking Borough Council election, English Wikipedia, retrieved 5 May 2018.
- ^ "Election of Borough Councillors for the Wards of Woking Borough Council Summary of Results" (PDF). Woking Borough Council. 8 May 2015. Retrieved 5 May 2018.
- ^ "Election of Borough Councillors for the Wards of Woking Borough Council Summary of Results" (PDF). Woking Borough Council. 23 May 2014. Retrieved 5 May 2018.
- ^ a b c d e f g h i j k l m n o p q r s t u v w x y z aa ab ac Colin Rallings; Michael Thrasher (2012). "Woking Borough Council Election Results, 1973–2012" (PDF). The Elections Centre, University of Plymouth. Retrieved 5 May 2018.
- ^ "The Borough of Woking (Electoral Changes) Order 1999", legislation.gov.uk, The National Archives, SI 2015/1462 Retrieved on 4 October 2015.
- ^ "Woking". BBC News Online. Retrieved 19 January 2010.
- ^ "The Surrey (District Boundaries) Order 1986", legislation.gov.uk, The National Archives, SI 1986/321 Retrieved on 6 November 2015.
- ^ The Runnymede and Woking (Areas) Order 1977
- ^ "The Borough of Woking (Electoral Arrangements) Order 1976", legislation.gov.uk, The National Archives, SI 1976/288 Retrieved on 19 November 2015.
- ^ "Byfleet By-Election Results". Woking Borough Council. 16 July 2001. Retrieved 19 January 2010.
- ^ "Local Elections Archive Project — Maybury and Sheerwater Ward". www.andrewteale.me.uk. Retrieved 21 December 2022.
- ^ "Local Elections Archive Project — Goldsworth East Ward". www.andrewteale.me.uk. Retrieved 21 December 2022.
- ^ "Local Elections Archive Project — Goldsworth West Ward". www.andrewteale.me.uk. Retrieved 21 December 2022.
- ^ "Local Elections Archive Project — Hoe Valley Ward". www.andrewteale.me.uk. Retrieved 2 September 2025.