


Hertsmere Borough Council elections
Hertsmere Borough Council elections are held every four years to elect members of Hertsmere Borough Council in Hertfordshire, England. Since the last boundary changes in 2019, the council comprises 39 councillors elected from 16 wards.[1]
Council elections
| Year | Conservative | Labour | Liberal Democrats[a] | Independents & Others |
Council control after election | |||
|---|---|---|---|---|---|---|---|---|
| Local government reorganisation; council established (55 seats) | ||||||||
| 1973 | 26 | 17 | 12 | 0 | No overall control | |||
| New ward boundaries (39 seats)[3] | ||||||||
| 1976 | 25 | 10 | 4 | 0 | Conservative | |||
| 1978 | 25 | 10 | 4 | 0 | Conservative | |||
| 1979 | 24 | 11 | 4 | 0 | Conservative | |||
| 1980 | 22 | 12 | 5 | 0 | Conservative | |||
| 1982 | 21 | 12 | 6 | 0 | Conservative | |||
| 1983 | 21 | 12 | 6 | 0 | Conservative | |||
| 1984 | 23 | 12 | 4 | 0 | Conservative | |||
| 1986 | 22 | 12 | 5 | 0 | Conservative | |||
| 1987 | 22 | 12 | 5 | 0 | Conservative | |||
| 1988 | 22 | 12 | 5 | 0 | Conservative | |||
| 1990 | 22 | 12 | 4 | 1 | Conservative | |||
| 1991 | 22 | 12 | 4 | 1 | Conservative | |||
| 1992 | 23 | 12 | 3 | 1 | Conservative | |||
| 1994[4][5][6] | 19 | 14 | 5 | 1 | No overall control | |||
| 1995 | 14 | 19 | 5 | 1 | No overall control | |||
| 1996 | 8 | 22 | 8 | 1 | Labour | |||
| 1998 | 11 | 22 | 6 | 0 | Labour | |||
| New ward boundaries (39 seats)[7][8] | ||||||||
| 1999 | 20 | 13 | 6 | 0 | Conservative | |||
| 2000 | 22 | 13 | 6 | 0 | Conservative | |||
| 2002 | 24 | 9 | 5 | 1 | Conservative | |||
| 2003 | 25 | 8 | 6 | 0 | Conservative | |||
| 2004 | 25 | 7 | 7 | 0 | Conservative | |||
| 2006 | 28 | 5 | 6 | 0 | Conservative | |||
| 2007 | 28 | 5 | 6 | 0 | Conservative | |||
| 2008 | 31 | 3 | 5 | 0 | Conservative | |||
| 2010 | 34 | 3 | 2 | 0 | Conservative | |||
| 2011 | 35 | 4 | 0 | 0 | Conservative | |||
| 2012 | 34 | 5 | 0 | 0 | Conservative | |||
| 2014 | 34 | 5 | 0 | 0 | Conservative | |||
| 2015 | 37 | 2 | 0 | 0 | Conservative | |||
| New ward boundaries (39 seats)[9] | ||||||||
| 2019 | 29 | 7 | 3 | 0 | Conservative | |||
| 2023 | 16 | 14 | 9 | 0 | No overall control | |||
Borough result maps
1976 boundaries
-
 1976 results map
 -
 1978 results map
 -
 1979 results map
 -
 1980 results map
 -
 1982 results map
 -
 1983 results map
 -
 1984 results map
 -
 1986 results map
 -
 1987 results map
 -
 1988 results map
 -
 1990 results map
 -
 1991 results map
 -
 1992 results map
 -
 1994 results map
 -
 1995 results map
 -
 1996 results map
 -
 1998 results map


1999 boundaries
-
 1999 results map
 -
 2000 results map
 -
 2002 results map
 -
 2003 results map
 -
 2004 results map
 -
 2006 results map
 -
 2007 results map
 -
 2008 results map
 -
 2010 results map
 -
 2011 results map
 -
 2012 results map
 -
 2014 results map
 -
 2015 results map


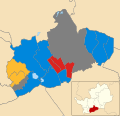
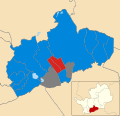
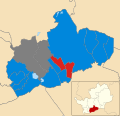
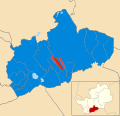
2019 boundaries
-
 2019 results map
 -
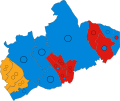 2023 results map


By-election results
1998-2002
| Party | Candidate | Votes | % | ±% | |
|---|---|---|---|---|---|
| Labour | Leon Reefe | 1,386 | 50.2 | −6.9 | |
| Conservative | Dora O'Sullivan | 878 | 31.8 | −11.1 | |
| Liberal Democrats | Mary Marsh | 497 | 18.0 | +18.0 | |
| Majority | 508 | 18.4 | |||
| Turnout | 2,761 | 55.1 | |||
| Labour hold | Swing | ||||
2002-2006
| Party | Candidate | Votes | % | ±% | |
|---|---|---|---|---|---|
| Labour | Peter Hedges | 1,519 | 51.3 | +12.5 | |
| Conservative | Alan Gellatly | 1,017 | 34.4 | +0.8 | |
| Liberal Democrats | Mark Silverman | 423 | 14.3 | +14.3 | |
| Majority | 502 | 16.9 | |||
| Turnout | 2,959 | 56.9 | |||
| Labour hold | Swing | ||||
2006-2010
| Party | Candidate | Votes | % | ±% | |
|---|---|---|---|---|---|
| Conservative | Tugay Sevincli | 679 | 76.6 | +5.4 | |
| Labour | Paul Tengwo | 207 | 23.4 | −5.4 | |
| Majority | 472 | 53.2 | |||
| Turnout | 886 | 17.1 | |||
| Conservative hold | Swing | ||||
| Party | Candidate | Votes | % | ±% | |
|---|---|---|---|---|---|
| Conservative | Paul Morris | 748 | 74.8 | −3.9 | |
| Liberal Democrats | Anita Ownsworth | 157 | 15.7 | +6.8 | |
| Labour | Charles George | 95 | 9.5 | +1.3 | |
| Majority | 591 | 59.1 | |||
| Turnout | 1,000 | 20.3 | |||
| Conservative hold | Swing | ||||
2010-2014
| Party | Candidate | Votes | % | ±% | |
|---|---|---|---|---|---|
| Conservative | Farida Turner | 703 | 41.8 | −4.6 | |
| Labour | Tony Breslin | 518 | 30.8 | −5.4 | |
| UKIP | Mark Silverman | 397 | 23.6 | +10.9 | |
| Liberal Democrats | Anita Gamble | 62 | 3.7 | −1.1 | |
| Majority | 185 | 11.0 | |||
| Turnout | 1,680 | ||||
| Conservative hold | Swing | ||||
2015-2019
| Party | Candidate | Votes | % | ±% | |
|---|---|---|---|---|---|
| Conservative | Sarah Hodgson-Jones | 882 | 59.2 | +4.3 | |
| Labour | John Doolan | 445 | 29.9 | −1.4 | |
| UKIP | Vikki Johnson | 163 | 10.9 | +10.9 | |
| Majority | 437 | 29.3 | |||
| Turnout | 1,490 | ||||
| Conservative hold | Swing | ||||
| Party | Candidate | Votes | % | ±% | |
|---|---|---|---|---|---|
| Labour | Jeremy Newmark | 383 | 37.8 | −10.1 | |
| Conservative | Pat Strack | 341 | 33.7 | −19.4 | |
| Liberal Democrats | Mary Marsh | 144 | 14.2 | +14.2 | |
| Independent | Lawrence Strack | 91 | 9.0 | +9.0 | |
| UKIP | Vikki Johnson | 54 | 5.3 | +5.3 | |
| Majority | 42 | 4.1 | |||
| Turnout | 1,013 | ||||
| Labour gain from Conservative | Swing | ||||
| Party | Candidate | Votes | % | ±% | |
|---|---|---|---|---|---|
| Labour | Rebecca Butler | 709 | 59.8 | +3.4 | |
| Conservative | Sean Moore | 381 | 32.2 | −11.4 | |
| UKIP | David Hoy | 57 | 4.8 | +4.8 | |
| Liberal Democrats | Paul Robinson | 20 | 1.7 | +1.7 | |
| Green | Nicholas Winston | 18 | 1.5 | +1.5 | |
| Majority | 328 | 4.1 | |||
| Turnout | 1,185 | ||||
| Labour gain from Conservative | Swing | ||||
2019-2023
| Party | Candidate | Votes | % | ±% | |
|---|---|---|---|---|---|
| Conservative | Brett Rosehill | 776 | 49.0 | +3.6 | |
| Labour | Dan Ozarow | 655 | 41.3 | −13.3 | |
| Liberal Democrats | Andy Lewis | 104 | 6.6 | +6.6 | |
| Green | John Humphries | 50 | 3.2 | +3.2 | |
| Majority | 121 | 7.6 | |||
| Turnout | 1,585 | ||||
| Conservative gain from Labour | Swing | ||||
| Party | Candidate | Votes | % | ±% | |
|---|---|---|---|---|---|
| Labour | Dan Ozarow | 1,119 | 53.3 | −1.3 | |
| Conservative | David Neifeld | 828 | 39.4 | −6.0 | |
| Liberal Democrats | Darren Diamond | 152 | 7.2 | +7.2 | |
| Majority | 291 | 13.9 | |||
| Turnout | 2,099 | ||||
| Labour gain from Conservative | Swing | ||||
| Party | Candidate | Votes | % | ±% | |
|---|---|---|---|---|---|
| Liberal Democrats | Alan Matthews | 1,136 | 49.2 | +9.2 | |
| Conservative | Jane West | 785 | 34.0 | +1.9 | |
| Labour | John Barratt | 265 | 11.5 | −5.9 | |
| Green | Matt Wheeler | 125 | 5.4 | +5.4 | |
| Majority | 351 | 15.2 | |||
| Turnout | 2,311 | ||||
| Liberal Democrats hold | Swing | ||||
2023-2027
| Party | Candidate | Votes | % | ±% | |
|---|---|---|---|---|---|
| Conservative | Glenn Briski | 478 | 29.6 | ||
| Reform | Gus Channer | 394 | 24.4 | ||
| Independent | Michelle Vince | 339 | 21.0 | ||
| Labour | Bala Mere | 295 | 18.3 | ||
| Liberal Democrats | Rosalind Levine | 47 | 2.9 | ||
| Green | Madalyn Bielfeld | 37 | 2.3 | ||
| Independent | Lawrence Stack | 26 | 1.6 | ||
| Majority | 84 | 5.2 | |||
| Turnout | 1,616 | ||||
| Conservative hold | Swing | ||||
Notes
- ^ Includes totals for the predecessors of the Liberal Democrats, the Liberal Party and SDP (both of which participated in the Alliance).
References
- ^ "The Hertsmere (Electoral Changes) Order 2018", legislation.gov.uk, The National Archives, SI 2018/535, retrieved 14 May 2023
- ^ "Composition calculator". Colin Rallings & Michael Thrasher. The Elections Centre, Plymouth University. Retrieved 14 May 2025.
- ^ legislation.gov.uk - The District of Hertsmere (Electoral Arrangements) Order 1976. Retrieved on 19 November 2015.
- ^ legislation.gov.uk - The Greater London and Hertfordshire (County and District Boundaries) Order 1992. Retrieved on 5 November 2015.
- ^ legislation.gov.uk - The Greater London and Hertfordshire (County Boundaries) Order 1992. Retrieved on 5 November 2015.
- ^ legislation.gov.uk - The Essex, Greater London and Hertfordshire (County and London Borough Boundaries) Order 1993. Retrieved on 5 November 2015.
- ^ "Hertsmere". * BBC News Online. Retrieved 23 October 2009.
- ^ legislation.gov.uk - The Borough of Hertsmere (Electoral Changes) Order 1998. Retrieved on 4 October 2015.
- ^ "The Hertsmere (Electoral Changes) Order 2018". gov.uk. 25 April 2018. Retrieved 28 September 2021.
- ^ "Election Results". Hertsmere Borough Council. Archived from the original on 22 June 2002. Retrieved 21 October 2011.
- ^ "Election results - 2005". Hertsmere. Archived from the original on 9 June 2009. Retrieved 23 October 2009.
- ^ "By-election results October 2009". Hertsmere. Archived from the original on 11 May 2010. Retrieved 23 October 2009.
- ^ "Tory victory in by-elections". Borehamwood & Elstree Times. 23 October 2009. Retrieved 23 October 2009.
- ^ "By-election results November 2009". Hertsmere. Archived from the original on 11 May 2010. Retrieved 27 November 2009.
- ^ "Local Elections Archive Project — Borehamwood Hillside Ward". www.andrewteale.me.uk. Retrieved 11 May 2024.
- ^ "Local Elections Archive Project — Potters Bar Oakmere Ward". www.andrewteale.me.uk. Retrieved 11 May 2024.
- ^ "Local Elections Archive Project — Borehamwood Kenilworth Ward". www.andrewteale.me.uk. Retrieved 11 May 2024.
- ^ "Local Elections Archive Project — Borehamwood Cowley Hill Ward". www.andrewteale.me.uk. Retrieved 11 May 2024.
- ^ "Local Elections Archive Project — Borehamwood Kenilworth Ward". www.andrewteale.me.uk. Retrieved 11 May 2024.
- ^ "Local Elections Archive Project — Borehamwood Kenilworth Ward". www.andrewteale.me.uk. Retrieved 11 May 2024.
- ^ "Local Elections Archive Project — Bushey North Ward". www.andrewteale.me.uk. Retrieved 11 May 2024.
- ^ "Local Elections Archive Project — Borehamwood Brookmeadow Ward". www.andrewteale.me.uk. Retrieved 16 August 2025.
- By-election results Archived 29 March 2010 at the Wayback Machine