


Collingsworth County, Texas
Collingsworth County, Texas | |
|---|---|
 Collingsworth County Courthouse in Wellington | |
 Location within the U.S. state of Texas | |
| Coordinates: 34°58′N 100°16′W / 34.97°N 100.27°W | |
| Country | |
| State | |
| Founded | 1890 |
| Named after | James Collinsworth |
| Seat | Wellington |
| Largest city | Wellington |
| Area | |
• Total | 919 sq mi (2,380 km2) |
| • Land | 918 sq mi (2,380 km2) |
| • Water | 0.9 sq mi (2.3 km2) 0.1% |
| Population (2020) | |
• Total | 2,652 |
| • Density | 2.89/sq mi (1.12/km2) |
| Time zone | UTC−6 (Central) |
| • Summer (DST) | UTC−5 (CDT) |
| Congressional district | 13th |
| Website | www |
Collingsworth County is a county in the U.S. state of Texas. As of the 2020 census, its population was 2,652.[1][2] Its county seat is Wellington.[3] The county was created in 1876 and later organized in 1890.[4] It is named for James Collinsworth,[5] a signer of the Texas Declaration of Independence and first chief justice of the Republic of Texas (a recording error in the bill accounts for the error in spelling, which was never corrected). Collingsworth County was one of 30[6] prohibition, or entirely dry, counties in Texas, but a vote in 2017 changed this law.[7]
History
The county was created in 1876 from the Bexar and Young land district of Texas. Collingsworth County was organized in 1890 with Wellington as the county seat. From 1883 until 1896 the county was home to the English owned Rocking Chair Ranche.
Geography
According to the U.S. Census Bureau, the county has a total area of 919 square miles (2,380 km2), of which 918 square miles (2,380 km2) is land and 0.9 square miles (2.3 km2) (0.1%) is water.[8]
Major highways
Adjacent counties
- Wheeler County (north)
- Beckham County, Oklahoma (northeast)
- Harmon County, Oklahoma (southeast)
- Childress County (south)
- Hall County (southwest)
- Donley County (west)
- Gray County (northwest)
Demographics
| Census | Pop. | Note | %± |
|---|---|---|---|
| 1880 | 6 | — | |
| 1890 | 357 | 5,850.0% | |
| 1900 | 1,233 | 245.4% | |
| 1910 | 5,224 | 323.7% | |
| 1920 | 9,154 | 75.2% | |
| 1930 | 14,461 | 58.0% | |
| 1940 | 10,331 | −28.6% | |
| 1950 | 9,139 | −11.5% | |
| 1960 | 6,276 | −31.3% | |
| 1970 | 4,755 | −24.2% | |
| 1980 | 4,648 | −2.3% | |
| 1990 | 3,573 | −23.1% | |
| 2000 | 3,206 | −10.3% | |
| 2010 | 3,057 | −4.6% | |
| 2020 | 2,652 | −13.2% | |
| 2024 (est.) | 2,611 | −1.5% | |
| U.S. Decennial Census[10] 1850–2010[11] 2010[12] 2020[13] | |||
Racial and ethnic composition
| Race / Ethnicity (NH = Non-Hispanic) | Pop 2000[14] | Pop 2010[12] | Pop 2020[13] | % 2000 | % 2010 | % 2020 |
|---|---|---|---|---|---|---|
| White alone (NH) | 2,289 | 1,937 | 1,617 | 71.40% | 63.36% | 60.97% |
| Black or African American alone (NH) | 169 | 122 | 108 | 5.27% | 3.99% | 4.07% |
| Native American or Alaska Native alone (NH) | 46 | 41 | 23 | 1.43% | 1.34% | 0.87% |
| Asian alone (NH) | 6 | 3 | 7 | 0.19% | 0.10% | 0.26% |
| Pacific Islander alone (NH) | 0 | 0 | 1 | 0.00% | 0.00% | 0.04% |
| Other race alone (NH) | 3 | 5 | 0 | 0.09% | 0.16% | 0.00% |
| Mixed race or Multiracial (NH) | 38 | 33 | 64 | 1.19% | 1.08% | 2.41% |
| Hispanic or Latino (any race) | 655 | 916 | 832 | 20.43% | 29.96% | 31.37% |
| Total | 3,206 | 3,057 | 2,652 | 100.00% | 100.00% | 100.00% |
2020 census
As of the 2020 census, the county had a population of 2,652, with a median age of 42.2 years. 25.0% of residents were under the age of 18 and 22.4% were 65 years of age or older. For every 100 females there were 91.5 males, and for every 100 females age 18 and over there were 89.2 males.[15][16]
The racial makeup of the county was 72.7% White, 4.6% Black or African American, 1.4% American Indian and Alaska Native, 0.3% Asian, <0.1% Native Hawaiian and Pacific Islander, 10.1% from some other race, and 10.8% from two or more races. Hispanic or Latino residents of any race comprised 31.4% of the population.[16]
<0.1% of residents lived in urban areas, while 100.0% lived in rural areas.[17]
There were 1,096 households in the county, of which 31.6% had children under the age of 18 living in them. Of all households, 49.9% were married-couple households, 16.1% were households with a male householder and no spouse or partner present, and 28.0% were households with a female householder and no spouse or partner present. About 26.7% of all households were made up of individuals and 14.5% had someone living alone who was 65 years of age or older.[15]
There were 1,481 housing units, of which 26.0% were vacant. Among occupied housing units, 78.2% were owner-occupied and 21.8% were renter-occupied. The homeowner vacancy rate was 2.4% and the rental vacancy rate was 16.3%.[15]
2000 census
As of the census[18] of 2000, there were 3,206 people, 1,294 households, and 916 families residing in the county. The population density was 4 inhabitants per square mile (1.5/km2). There were 1,723 housing units at an average density of 2 per square mile (0.77/km2). The racial makeup of the county was 79.82% White, 5.33% Black or African American, 1.62% Native American, 0.19% Asian, 10.89% from other races, and 2.15% from two or more races. 20.43% of the population were Hispanic or Latino of any race.
There were 1,294 households, out of which 29.80% had children under the age of 18 living with them, 57.50% were married couples living together, 9.80% had a female householder with no husband present, and 29.20% were non-families. 27.80% of all households were made up of individuals, and 17.50% had someone living alone who was 65 years of age or older. The average household size was 2.44 and the average family size was 2.97.
In the county, the population was spread out, with 26.40% under the age of 18, 6.60% from 18 to 24, 22.60% from 25 to 44, 22.50% from 45 to 64, and 22.00% who were 65 years of age or older. The median age was 41 years. For every 100 females there were 93.00 males. For every 100 females age 18 and over, there were 88.00 males.
The median income for a household in the county was $25,438, and the median income for a family was $33,323. Males had a median income of $24,808 versus $17,679 for females. The per capita income for the county was $15,318. About 14.80% of families and 18.70% of the population were below the poverty line, including 27.20% of those under age 18 and 16.40% of those age 65 or over.
Communities
City
- Wellington (county seat)
Town
Census-designated places
Unincorporated communities
Ghost towns
Politics
Collingsworth County is located within District 88 of the Texas House of Representatives. Collinsworth County is located within District 28 of the Texas Senate.
| Year | Republican | Democratic | Third party(ies) | |||
|---|---|---|---|---|---|---|
| No. | % | No. | % | No. | % | |
| 1912 | 14 | 3.08% | 414 | 90.99% | 27 | 5.93% |
| 1916 | 31 | 4.56% | 589 | 86.62% | 60 | 8.82% |
| 1920 | 307 | 30.49% | 640 | 63.56% | 60 | 5.96% |
| 1924 | 234 | 23.68% | 731 | 73.99% | 23 | 2.33% |
| 1928 | 1,179 | 65.98% | 608 | 34.02% | 0 | 0.00% |
| 1932 | 115 | 6.12% | 1,753 | 93.29% | 11 | 0.59% |
| 1936 | 158 | 7.27% | 2,012 | 92.63% | 2 | 0.09% |
| 1940 | 307 | 13.09% | 2,034 | 86.70% | 5 | 0.21% |
| 1944 | 261 | 12.07% | 1,725 | 79.79% | 176 | 8.14% |
| 1948 | 198 | 9.48% | 1,779 | 85.16% | 112 | 5.36% |
| 1952 | 1,334 | 50.21% | 1,321 | 49.72% | 2 | 0.08% |
| 1956 | 815 | 39.66% | 1,229 | 59.81% | 11 | 0.54% |
| 1960 | 1,084 | 60.83% | 691 | 38.78% | 7 | 0.39% |
| 1964 | 724 | 38.68% | 1,145 | 61.16% | 3 | 0.16% |
| 1968 | 712 | 36.83% | 746 | 38.59% | 475 | 24.57% |
| 1972 | 1,250 | 71.39% | 501 | 28.61% | 0 | 0.00% |
| 1976 | 629 | 34.87% | 1,169 | 64.80% | 6 | 0.33% |
| 1980 | 1,020 | 55.11% | 798 | 43.11% | 33 | 1.78% |
| 1984 | 1,396 | 64.96% | 742 | 34.53% | 11 | 0.51% |
| 1988 | 872 | 51.81% | 809 | 48.07% | 2 | 0.12% |
| 1992 | 697 | 43.56% | 635 | 39.69% | 268 | 16.75% |
| 1996 | 729 | 50.94% | 581 | 40.60% | 121 | 8.46% |
| 2000 | 974 | 68.83% | 429 | 30.32% | 12 | 0.85% |
| 2004 | 1,051 | 75.18% | 346 | 24.75% | 1 | 0.07% |
| 2008 | 943 | 78.91% | 234 | 19.58% | 18 | 1.51% |
| 2012 | 962 | 83.65% | 177 | 15.39% | 11 | 0.96% |
| 2016 | 983 | 85.03% | 145 | 12.54% | 28 | 2.42% |
| 2020 | 1,048 | 86.04% | 155 | 12.73% | 15 | 1.23% |
| 2024 | 1,066 | 88.76% | 135 | 11.24% | 0 | 0.00% |
| Year | Republican | Democratic | Third party(ies) | |||
|---|---|---|---|---|---|---|
| No. | % | No. | % | No. | % | |
| 2024 | 1,039 | 87.98% | 141 | 11.94% | 1 | 0.08% |
See also
- List of museums in the Texas Panhandle
- National Register of Historic Places listings in Collingsworth County, Texas
- Recorded Texas Historic Landmarks in Collingsworth County
References
- ^ "U.S. Census Bureau QuickFacts: Collingsworth County, Texas". United States Census Bureau. Retrieved January 31, 2022.
- ^ "Collingsworth County, Texas". United States Census Bureau. Retrieved January 30, 2022.
- ^ "Find a County". National Association of Counties. Archived from the original on May 31, 2011. Retrieved June 7, 2011.
- ^ "Texas: Individual County Chronologies". Texas Atlas of Historical County Boundaries. The Newberry Library. 2008. Archived from the original on April 12, 2017. Retrieved May 21, 2015.
- ^ Gannett, Henry (1905). The Origin of Certain Place Names in the United States. Govt. Print. Off. pp. 87.
- ^ "TABC Local Option Elections General Information". Archived from the original on May 16, 2014. Retrieved May 3, 2014.
- ^ "TABC Wet and Dry Counties". www.tabc.state.tx.us. Retrieved June 27, 2018.
- ^ "2010 Census Gazetteer Files". United States Census Bureau. August 22, 2012. Retrieved April 21, 2015.
- ^ "QuickFacts: Collingsworth County, Texas". United States Census Bureau. Retrieved June 12, 2025.
- ^ "Decennial Census of Population and Housing by Decades". US Census Bureau.
- ^ "Texas Almanac: Population History of Counties from 1850–2010" (PDF). Texas Almanac. Archived (PDF) from the original on October 9, 2022. Retrieved April 21, 2015.
- ^ a b "P2 Hispanic or Latino, and Not Hispanic or Latino by Race – 2010: DEC Redistricting Data (PL 94-171) – Collingsworth County, Texas". United States Census Bureau.
- ^ a b "P2 Hispanic or Latino, and Not Hispanic or Latino by Race – 2020: DEC Redistricting Data (PL 94-171) – Collingsworth County, Texas". United States Census Bureau.
- ^ "P004: Hispanic or Latino, and Not Hispanic or Latino by Race – 2000: DEC Summary File 1 – Collingsworth County, Texas". United States Census Bureau.
- ^ a b c "2020 Decennial Census Demographic Profile (DP1)". United States Census Bureau. 2021. Retrieved January 9, 2026.
- ^ a b "2020 Decennial Census Redistricting Data (Public Law 94-171)". United States Census Bureau. 2021. Retrieved January 9, 2026.
- ^ "2020 Decennial Census Demographic and Housing Characteristics (DHC)". United States Census Bureau. 2023. Retrieved January 9, 2026.
- ^ "U.S. Census website". United States Census Bureau. Retrieved May 14, 2011.
- ^ Leip, David. "Dave Leip's Atlas of U.S. Presidential Elections". uselectionatlas.org. Retrieved July 20, 2018.
- ^ "2024 Senate Election (Official Returns)". Commonwealth of Texas by county. November 5, 2024. Retrieved December 5, 2024.
External links
- Official website

- Collingsworth County from the Handbook of Texas Online
- Collingsworth Public Library
- Collingsworth County Sheriff's Department
Places adjacent to Collingsworth County, Texas | ||||||||||||||||
|---|---|---|---|---|---|---|---|---|---|---|---|---|---|---|---|---|
| ||||||||||||||||
Municipalities and communities of Collingsworth County, Texas, United States | ||
|---|---|---|
| City | 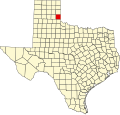 | |
| Town | ||
| CDPs | ||
| Other unincorporated communities | ||
| Ghost towns | ||
| International | |
|---|---|
| National | |
| Geographic | |
| Other | |