


Marrowbone, Cumberland County, Kentucky
Marrowbone, Kentucky | |
|---|---|
 Modern Woodmen lodge building on Kentucky Route 90 | |
 Marrowbone Location within the state of Kentucky  Marrowbone Marrowbone (the United States) | |
| Coordinates: 36°49′39″N 85°30′24″W / 36.82750°N 85.50667°W | |
| Country | United States |
| State | Kentucky |
| County | Cumberland |
| Area | |
• Total | 1.29 sq mi (3.34 km2) |
| • Land | 1.27 sq mi (3.30 km2) |
| • Water | 0.015 sq mi (0.04 km2) |
| Elevation | 643 ft (196 m) |
| Population (2020) | |
• Total | 147 |
| • Density | 115.4/sq mi (44.54/km2) |
| Time zone | UTC-6 (Central (CST)) |
| • Summer (DST) | UTC-5 (CDT) |
| ZIP codes | 42759 |
| FIPS code | 21-50124 |
| GNIS feature ID | 497558 |
Marrowbone is a census-designated place in Cumberland County, Kentucky, United States. As of the 2010 census it had a population of 217.[2] It has a post office, with the ZIP code of 42759.[3]
The Marrowbone Historic District, which includes three properties, is listed on the National Register of Historic Places.
Geography
It lies along Kentucky Route 90 west of the city of Burkesville, the county seat of Cumberland County.[4] Its elevation is 643 feet (196 m), and it is located at about (36.8288889, -85.5030556).[5]
Demographics
| Census | Pop. | Note | %± |
|---|---|---|---|
| 2010 | 217 | — | |
| 2020 | 147 | −32.3% | |
| U.S. Decennial Census[6] | |||
Marrowbone first appeared as a census designated place in the 2010 U.S. census.
2020 census
| Race / Ethnicity (NH = Non-Hispanic) | Pop 2010[7] | Pop 2020[8] | % 2010 | % 2020 |
|---|---|---|---|---|
| White alone (NH) | 208 | 135 | 95.85% | 91.84% |
| Black or African American alone (NH) | 3 | 3 | 1.38% | 2.04% |
| Native American or Alaska Native alone (NH) | 1 | 0 | 0.46% | 0.00% |
| Asian alone (NH) | 0 | 0 | 0.00% | 0.00% |
| Native Hawaiian or Pacific Islander alone (NH) | 0 | 0 | 0.00% | 0.00% |
| Other race alone (NH) | 0 | 0 | 0.00% | 0.00% |
| Mixed race or Multiracial (NH) | 5 | 5 | 2.30% | 3.40% |
| Hispanic or Latino (any race) | 0 | 4 | 0.00% | 2.72% |
| Total | 217 | 147 | 100.00% | 100.00% |
References
- ^ "2020 U.S. Gazetteer Files". United States Census Bureau. Retrieved March 18, 2022.
- ^ "Geographic Identifiers: 2010 Demographic Profile Data (G001): Marrowbone CDP, Kentucky". U.S. Census Bureau, American Factfinder. Retrieved August 13, 2014.
{{cite web}}: CS1 maint: deprecated archival service (link) - ^ Zip Code Lookup
- ^ Rand McNally. The Road Atlas '06. Chicago: Rand McNally, 2006, p. 42.
- ^ U.S. Geological Survey Geographic Names Information System: Marrowbone, Cumberland County, Kentucky, Geographic Names Information System, September 20, 1979. Accessed 2007-12-31.
- ^ "Census of Population and Housing". Census.gov. Retrieved June 4, 2016.
- ^ "P2 Hispanic or Latino, and Not Hispanic or Latino by Race – 2010: DEC Redistricting Data (PL 94-171) – Marrowbone CDP, Kentucky". United States Census Bureau.
- ^ "P2 Hispanic or Latino, and Not Hispanic or Latino by Race – 2020: DEC Redistricting Data (PL 94-171) – Marrowbone CDP, Kentucky". United States Census Bureau.
Municipalities and communities of Cumberland County, Kentucky, United States | ||
|---|---|---|
| City | 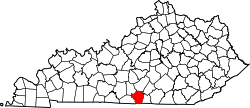 | |
| CDP | ||
| Other unincorporated communities | ||