


Torridge District Council elections


Torridge District Council in Devon, England is elected every four years. Since the last boundary changes in 2003, 36 councillors have been elected from 23 wards.[1]
Council elections
Summary of the council composition after recent council elections, click on the year for full details of each election. Boundary changes took place for the 2003 election.[2]
- 1973 Torridge District Council election
- 1976 Torridge District Council election
- 1979 Torridge District Council election (New ward boundaries & district boundary changes also took place)[3][4]
- 1983 Torridge District Council election
- 1987 Torridge District Council election
- 1991 Torridge District Council election[5]
- 1995 Torridge District Council election[6]
- 1999 Torridge District Council election
- 2003 Torridge District Council election
- 2007 Torridge District Council election
- 2011 Torridge District Council election
- 2015 Torridge District Council election
- 2019 Torridge District Council election
- 2023 Torridge District Council election
Summary results
| Year | Conservative | Labour | Liberal Democrats[a] | Green[b] | UKIP | Independents & Others |
Council control after election | |
|---|---|---|---|---|---|---|---|---|
| Local government reorganisation; council established (36 seats) | ||||||||
| 1973 | 0 | 1 | 6 | – | – | 29 | Independent | |
| 1976 | 3 | 5 | 6 | 0 | – | 22 | Independent | |
| New ward boundaries (36 seats) | ||||||||
| 1979 | 5 | 1 | 1 | 0 | – | 29 | Independent | |
| 1983 | 3 | 1 | 3 | 0 | – | 29 | Independent | |
| 1987 | 8 | 3 | 2 | 0 | – | 23 | Independent | |
| 1991 | 5 | 4 | 4 | 0 | – | 23 | Independent | |
| 1995 | 2 | 5 | 13 | 0 | 0 | 16 | No overall control | |
| 1999 | 1 | 2 | 12 | 0 | 0 | 21 | Independent | |
| New ward boundaries (36 seats) | ||||||||
| 2003 | 1 | 0 | 7 | 1 | 1 | 27[c] | No overall control | |
| 2007 | 13 | 0 | 8 | 2 | 0 | 13 | No overall control | |
| 2011 | 18 | 1 | 6 | 1 | 0 | 10 | No overall control | |
| 2015 | 19 | 1 | 1 | 2 | 7 | 6 | Conservative | |
| New ward boundaries (36 seats) | ||||||||
| 2019 | 11 | 3 | 2 | 2 | 0 | 18 | No overall control | |
| 2023 | 6 | 2 | 8 | 4 | 0 | 16 | No overall control | |
District result maps
-
 2003 results map
 -
 2007 results map
 -
 2011 results map
 -
 2015 results map
 -
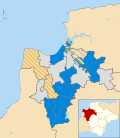
 2019 results map
 -
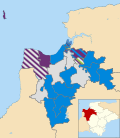
 2023 results map


By-election results
By-elections occur when seats become vacant between council elections. Below is a summary of recent by-elections;[8] full by-election results can be found by clicking on the by-election name.
References
- ^ Includes totals for the predecessors of the Liberal Democrats, the Liberal Party and SDP (both of which participated in the Alliance).
- ^ Includes totals for the predecessors of the Green Party of England and Wales, the Ecology Party and Green Party UK.
- ^ 17 Independents, 9 Community Alliance
- ^ "Torridge District Elections". Torridge District Council. Retrieved 26 September 2009.
- ^ "Local elections". BBC News Online. Retrieved 23 June 2014.
- ^ The Cornwall and Devon (Areas) Order 1977
- ^ The District of Torridge (Electoral Arrangements) Order 1978
- ^ "Complete round-up of results from Thursday's local council elections". The Times. NewsBank. 4 May 1991.
- ^ "Election results round-up - Local elections". The Times. NewsBank. 5 May 1995.
- ^ "Composition calculator". Colin Rallings & Michael Thrasher. The Elections Centre, Plymouth University. Retrieved 14 May 2025.
- ^ "Local Authority Byelection Results". Retrieved 23 June 2014.