


Phillips County, Colorado
Phillips County, Colorado | |
|---|---|
 | |
 Seal | |
 Location within the U.S. state of Colorado | |
| Coordinates: 40°35′N 102°21′W / 40.59°N 102.35°W | |
| Country | |
| State | |
| Founded | March 27, 1889 |
| Named after | R.O. Phillips |
| Seat | Holyoke |
| Largest city | Holyoke |
| Area | |
• Total | 688 sq mi (1,780 km2) |
| • Land | 688 sq mi (1,780 km2) |
| • Water | 0.1 sq mi (0.26 km2) 0.02% |
| Population (2020) | |
• Total | 4,530 |
• Estimate (2024) | 4,488 |
| • Density | 6.58/sq mi (2.54/km2) |
| Time zone | UTC−7 (Mountain) |
| • Summer (DST) | UTC−6 (MDT) |
| Congressional district | 4th |
| Website | phillipscounty |
Phillips County is a county located in the U.S. state of Colorado. As of the 2020 census, the population was 4,530.[1] The county seat is Holyoke.[2] The county was named in honor of R.O. Phillips, a secretary of the Lincoln Land Company, which organized several towns in Colorado.
Geography

According to the U.S. Census Bureau, the county has a total area of 688 square miles (1,780 km2), of which 688 square miles (1,780 km2) is land and 0.1 square miles (0.26 km2) (0.02%) is water.[3]
Adjacent counties
- Sedgwick County—north
- Perkins County, Nebraska—northeast
- Chase County, Nebraska—east
- Yuma County—south
- Logan County—west
Major highways
Demographics
| Census | Pop. | Note | %± |
|---|---|---|---|
| 1890 | 2,642 | — | |
| 1900 | 1,583 | −40.1% | |
| 1910 | 3,179 | 100.8% | |
| 1920 | 5,499 | 73.0% | |
| 1930 | 5,797 | 5.4% | |
| 1940 | 4,948 | −14.6% | |
| 1950 | 4,924 | −0.5% | |
| 1960 | 4,440 | −9.8% | |
| 1970 | 4,131 | −7.0% | |
| 1980 | 4,542 | 9.9% | |
| 1990 | 4,189 | −7.8% | |
| 2000 | 4,480 | 6.9% | |
| 2010 | 4,442 | −0.8% | |
| 2020 | 4,530 | 2.0% | |
| 2024 (est.) | 4,488 | [4] | −0.9% |
| U.S. Decennial Census[5] 1790–1960[6] 1900–1990[7] 1990–2000[8] 2010–2020[1] | |||
2020 census
As of the 2020 census, the county had a population of 4,530. Of the residents, 24.9% were under the age of 18 and 21.3% were 65 years of age or older; the median age was 41.4 years. For every 100 females there were 95.7 males, and for every 100 females age 18 and over there were 94.6 males. 0.0% of residents lived in urban areas and 100.0% lived in rural areas.[9][10][11]
| Race / Ethnicity (NH = Non-Hispanic) | Pop 2000[12] | Pop 2010[13] | Pop 2020[14] | % 2000 | % 2010 | % 2020 |
|---|---|---|---|---|---|---|
| White alone (NH) | 3,865 | 3,526 | 3,246 | 86.27% | 79.38% | 71.66% |
| Black or African American alone (NH) | 9 | 14 | 10 | 0.20% | 0.32% | 0.22% |
| Native American or Alaska Native alone (NH) | 11 | 13 | 12 | 0.25% | 0.29% | 0.26% |
| Asian alone (NH) | 18 | 26 | 22 | 0.40% | 0.59% | 0.49% |
| Pacific Islander alone (NH) | 1 | 4 | 1 | 0.02% | 0.09% | 0.02% |
| Other race alone (NH) | 8 | 4 | 5 | 0.18% | 0.09% | 0.11% |
| Mixed race or Multiracial (NH) | 41 | 25 | 79 | 0.92% | 0.56% | 1.74% |
| Hispanic or Latino (any race) | 527 | 830 | 1,155 | 11.76% | 18.69% | 25.50% |
| Total | 4,480 | 4,442 | 4,530 | 100.00% | 100.00% | 100.00% |
The racial makeup of the county was 77.3% White, 0.4% Black or African American, 1.1% American Indian and Alaska Native, 0.5% Asian, 0.0% Native Hawaiian and Pacific Islander, 10.6% from some other race, and 10.0% from two or more races. Hispanic or Latino residents of any race comprised 25.5% of the population.[11]
There were 1,814 households in the county, of which 31.5% had children under the age of 18 living with them and 22.5% had a female householder with no spouse or partner present. About 28.3% of all households were made up of individuals and 15.7% had someone living alone who was 65 years of age or older.[10]
There were 2,025 housing units, of which 10.4% were vacant. Among occupied housing units, 72.3% were owner-occupied and 27.7% were renter-occupied. The homeowner vacancy rate was 1.6% and the rental vacancy rate was 11.9%.[10]
2000 census
At the 2000 census there were 4,480 people, 1,781 households, and 1,239 families living in the county. The population density was 6 people per square mile (2.3 people/km2). There were 2,014 housing units at an average density of 3 units per square mile (1.2 units/km2). The racial makeup of the county was 93.04% White, 0.20% Black or African American, 0.29% Native American, 0.40% Asian, 0.02% Pacific Islander, 4.71% from other races, and 1.34% from two or more races. 11.76% of the population were Hispanic or Latino of any race.[15] Of the 1,781 households 32.90% had children under the age of 18 living with them, 61.20% were married couples living together, 5.60% had a female householder with no husband present, and 30.40% were non-families. Of all households 27.50% were one person and 14.30% were one person aged 65 or older. The average household size was 2.47 and the average family size was 3.01.
The age distribution was 26.90% under the age of 18, 6.30% from 18 to 24, 25.30% from 25 to 44, 22.20% from 45 to 64, and 19.40% 65 or older. The median age was 40 years. For every 100 females there were 93.40 males. For every 100 females age 18 and over, there were 90.50 males.
The median household income was $32,177 and the median family income was $38,144. Males had a median income of $30,095 versus $18,682 for females. The per capita income for the county was $16,394. About 8.80% of families and 11.60% of the population were below the poverty line, including 14.70% of those under age 18 and 7.20% of those age 65 or over.
Politics
| Year | Republican | Democratic | Third party(ies) | |||
|---|---|---|---|---|---|---|
| No. | % | No. | % | No. | % | |
| 1892 | 266 | 49.17% | 0 | 0.00% | 275 | 50.83% |
| 1896 | 196 | 36.84% | 334 | 62.78% | 2 | 0.38% |
| 1900 | 347 | 53.72% | 275 | 42.57% | 24 | 3.72% |
| 1904 | 444 | 68.20% | 140 | 21.51% | 67 | 10.29% |
| 1908 | 508 | 54.33% | 401 | 42.89% | 26 | 2.78% |
| 1912 | 266 | 22.37% | 448 | 37.68% | 475 | 39.95% |
| 1916 | 532 | 38.16% | 795 | 57.03% | 67 | 4.81% |
| 1920 | 1,191 | 66.80% | 480 | 26.92% | 112 | 6.28% |
| 1924 | 1,076 | 49.61% | 397 | 18.30% | 696 | 32.09% |
| 1928 | 1,440 | 65.16% | 705 | 31.90% | 65 | 2.94% |
| 1932 | 903 | 34.84% | 1,453 | 56.06% | 236 | 9.10% |
| 1936 | 941 | 36.15% | 1,602 | 61.54% | 60 | 2.31% |
| 1940 | 1,168 | 54.30% | 919 | 42.72% | 64 | 2.98% |
| 1944 | 1,455 | 65.16% | 761 | 34.08% | 17 | 0.76% |
| 1948 | 1,076 | 52.51% | 932 | 45.49% | 41 | 2.00% |
| 1952 | 1,670 | 67.72% | 789 | 32.00% | 7 | 0.28% |
| 1956 | 1,535 | 63.35% | 887 | 36.61% | 1 | 0.04% |
| 1960 | 1,455 | 62.77% | 862 | 37.19% | 1 | 0.04% |
| 1964 | 1,012 | 44.78% | 1,243 | 55.00% | 5 | 0.22% |
| 1968 | 1,237 | 56.87% | 723 | 33.24% | 215 | 9.89% |
| 1972 | 1,480 | 65.31% | 687 | 30.32% | 99 | 4.37% |
| 1976 | 1,142 | 48.12% | 1,173 | 49.43% | 58 | 2.44% |
| 1980 | 1,488 | 63.21% | 640 | 27.19% | 226 | 9.60% |
| 1984 | 1,689 | 71.36% | 651 | 27.50% | 27 | 1.14% |
| 1988 | 1,317 | 57.81% | 923 | 40.52% | 38 | 1.67% |
| 1992 | 1,075 | 46.68% | 692 | 30.05% | 536 | 23.27% |
| 1996 | 1,284 | 58.76% | 706 | 32.31% | 195 | 8.92% |
| 2000 | 1,573 | 70.86% | 564 | 25.41% | 83 | 3.74% |
| 2004 | 1,717 | 73.85% | 582 | 25.03% | 26 | 1.12% |
| 2008 | 1,613 | 71.34% | 622 | 27.51% | 26 | 1.15% |
| 2012 | 1,637 | 72.27% | 588 | 25.96% | 40 | 1.77% |
| 2016 | 1,791 | 76.80% | 436 | 18.70% | 105 | 4.50% |
| 2020 | 1,958 | 78.79% | 486 | 19.56% | 41 | 1.65% |
| 2024 | 1,888 | 80.17% | 412 | 17.49% | 55 | 2.34% |
Phillips County has historically had a Republican majority. It has not been carried by a Democratic presidential nominee since Jimmy Carter in 1976. Michael Dukakis has been the only Democrat since to receive over one-third of the county's ballots during a major drought in 1988.
Communities
City
Towns
Census-designated place
See also
- Bibliography of Colorado
- Geography of Colorado
- History of Colorado
- Index of Colorado-related articles
- List of Colorado-related lists
- Outline of Colorado
Notes
References
- ^ a b "State & County QuickFacts". United States Census Bureau. Retrieved September 5, 2021.
- ^ "Find a County". National Association of Counties. Retrieved June 7, 2011.
- ^ "US Gazetteer files: 2010, 2000, and 1990". United States Census Bureau. February 12, 2011. Retrieved April 23, 2011.
- ^ "County Population Totals and Components of Change: 2020-2024". United States Census Bureau. Retrieved June 3, 2025.
- ^ "U.S. Decennial Census". United States Census Bureau. Retrieved June 10, 2014.
- ^ "Historical Census Browser". University of Virginia Library. Retrieved June 10, 2014.
- ^ "Population of Counties by Decennial Census: 1900 to 1990". United States Census Bureau. Retrieved June 10, 2014.
- ^ "Census 2000 PHC-T-4. Ranking Tables for Counties: 1990 and 2000" (PDF). United States Census Bureau. Archived (PDF) from the original on March 27, 2010. Retrieved June 10, 2014.
- ^ "2020 Decennial Census Demographic and Housing Characteristics (DHC)". United States Census Bureau. 2023. Retrieved 2025-12-08.
- ^ a b c "2020 Decennial Census Demographic Profile (DP1)". United States Census Bureau. 2021. Retrieved 2025-12-08.
- ^ a b "2020 Decennial Census Redistricting Data (Public Law 94-171)". United States Census Bureau. 2021. Retrieved 2025-12-08.
- ^ "P004: Hispanic or Latino, and Not Hispanic or Latino by Race – 2000: DEC Summary File 1 – Phillips County, Colorado". United States Census Bureau. Retrieved February 7, 2026.
- ^ "P2 Hispanic or Latino, and Not Hispanic or Latino by Race – 2010: DEC Redistricting Data (PL 94-171) - Phillips County, Colorado". United States Census Bureau. Retrieved February 7, 2026.
- ^ "P2 Hispanic or Latino, and Not Hispanic or Latino by Race – 2020: DEC Redistricting Data (PL 94-171) - Phillips County, Colorado". United States Census Bureau. Retrieved February 7, 2026.
- ^ "U.S. Census website". United States Census Bureau. Retrieved May 14, 2011.
- ^ Leip, David. "Dave Leip's Atlas of U.S. Presidential Elections". uselectionatlas.org. Retrieved May 26, 2017.
External links
- State of Colorado
- Official website
- Phillips County Economic Development Corporation website
- Colorado County Evolution by Don Stanwyck
Municipalities and communities of Phillips County, Colorado, United States | ||
|---|---|---|
| City | 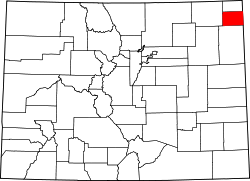 | |
| Towns | ||
| CDP | ||
Places adjacent to Phillips County, Colorado | ||||||||||||||||
|---|---|---|---|---|---|---|---|---|---|---|---|---|---|---|---|---|
| ||||||||||||||||
| International | |
|---|---|
| National | |
| Other | |