


Marion County, Iowa
Marion County, Iowa | |
|---|---|
 The Marion County Courthouse in Knoxville | |
 Location within the U.S. state of Iowa | |
| Coordinates: 41°19′52″N 93°06′08″W / 41.331111111111°N 93.102222222222°W | |
| Country | |
| State | |
| Founded | 1845 |
| Named after | Francis Marion |
| Seat | Knoxville |
| Largest city | Pella |
| Area | |
• Total | 571 sq mi (1,480 km2) |
| • Land | 555 sq mi (1,440 km2) |
| • Water | 16 sq mi (41 km2) 2.8% |
| Population (2020) | |
• Total | 33,414 |
• Estimate (2024) | 34,048 |
| • Density | 60.2/sq mi (23.2/km2) |
| Time zone | UTC−6 (Central) |
| • Summer (DST) | UTC−5 (CDT) |
| Congressional district | 1st |
| Website | www |
| |
Marion County is a county in the U.S. state of Iowa. As of the 2020 census, the population was 33,414.[2] The county seat is Knoxville.[3] It is named for Francis Marion, a brigadier general from South Carolina in the American Revolutionary War.[4]
Geography
According to the United States Census Bureau, the county has a total area of 571 square miles (1,480 km2), of which 555 square miles (1,440 km2) is land and 16 square miles (41 km2) (2.8%) is water.[5]
Major highways
Adjacent counties
- Jasper County (north)
- Mahaska County (east)
- Monroe County (southeast)
- Lucas County (southwest)
- Warren County (west)
Demographics
| Census | Pop. | Note | %± |
|---|---|---|---|
| 1850 | 5,482 | — | |
| 1860 | 16,813 | 206.7% | |
| 1870 | 24,436 | 45.3% | |
| 1880 | 25,111 | 2.8% | |
| 1890 | 23,058 | −8.2% | |
| 1900 | 24,159 | 4.8% | |
| 1910 | 22,995 | −4.8% | |
| 1920 | 24,957 | 8.5% | |
| 1930 | 25,727 | 3.1% | |
| 1940 | 27,019 | 5.0% | |
| 1950 | 25,930 | −4.0% | |
| 1960 | 25,886 | −0.2% | |
| 1970 | 26,352 | 1.8% | |
| 1980 | 29,669 | 12.6% | |
| 1990 | 30,001 | 1.1% | |
| 2000 | 32,052 | 6.8% | |
| 2010 | 33,309 | 3.9% | |
| 2020 | 33,414 | 0.3% | |
| 2024 (est.) | 34,048 | [6] | 1.9% |
| U.S. Decennial Census[7] 1790–1960[8] 1900–1990[9] 1990–2000[10] 2010–2020[11] | |||
2020 census

As of the 2020 census, the county had a population of 33,414 and a population density of 58.5/sq mi (22.6/km2). The median age was 41.1 years; 23.3% of residents were under age 18 and 19.6% were 65 years of age or older. For every 100 females there were 98.8 males, and for every 100 females age 18 and over there were 97.2 males.[12]
The racial makeup of the county was 93.2% White, 0.9% Black or African American, 0.2% American Indian and Alaska Native, 1.2% Asian, 0.1% Native Hawaiian and Pacific Islander, 0.6% from some other race, and 3.8% from two or more races. Hispanic or Latino residents of any race comprised 2.1% of the population.[13]
53.0% of residents lived in urban areas, while 47.0% lived in rural areas.[14]
There were 13,145 households in the county, of which 29.4% had children under the age of 18 living in them. Of all households, 55.6% were married-couple households, 17.0% were households with a male householder and no spouse or partner present, and 21.8% were households with a female householder and no spouse or partner present. About 27.7% of all households were made up of individuals and 12.7% had someone living alone who was 65 years of age or older.[12]
The 2020 census counted 14,073 housing units, of which 13,145 were occupied, leaving 6.6% vacant; 74.6% of occupied housing units were owner-occupied and 25.4% were renter-occupied, with a homeowner vacancy rate of 1.4% and a rental vacancy rate of 5.4%.[12]
2010 census
As of the 2010 census recorded a population of 33,309 in the county, with a population density of 60.1/sq mi (23.2/km2). There were 13,914 housing units, of which 12,723 were occupied.[15]
2000 census
As of the 2000 census, there were 32,052 people, 12,017 households, and 8,532 families residing in the county. The population density was 58 people per square mile (22 people/km2). There were 12,755 housing units at an average density of 23 units per square mile (8.9 units/km2). The racial makeup of the county was 97.46% White, 0.42% Black or African American, 0.19% Native American, 1.03% Asian, 0.04% Pacific Islander, 0.22% from other races, and 0.64% from two or more races. 0.80% of the population were Hispanic or Latino of any race.
There were 12,017 households, out of which 33.00% had children under the age of 18 living with them, 61.20% were married couples living together, 6.90% had a female householder with no husband present, and 29.00% were non-families. 25.60% of all households were made up of individuals, and 11.90% had someone living alone who was 65 years of age or older. The average household size was 2.50 and the average family size was 3.02.
In the county, the population was spread out, with 25.30% under the age of 18, 10.20% from 18 to 24, 26.50% from 25 to 44, 22.10% from 45 to 64, and 15.90% who were 65 years of age or older. The median age was 37 years. For every 100 females there were 98.60 males. For every 100 females age 18 and over, there were 95.80 males.
The median income for a household in the county was $42,401, and the median income for a family was $50,052. Males had a median income of $36,460 versus $25,573 for females. The per capita income for the county was $18,717. About 5.20% of families and 7.60% of the population were below the poverty line, including 8.70% of those under age 18 and 10.80% of those age 65 or over.
Communities
Cities
Unincorporated communities
Townships
Population ranking

The population ranking of the following table is based on the 2020 census of Marion County.[2]
† county seat
| Rank | City/town/etc. | Municipal type | Population (2020 Census) |
|---|---|---|---|
| 1 | Pella | City | 10,464 |
| 2 | † Knoxville | City | 7,595 |
| 3 | Pleasantville | City | 1,676 |
| 4 | Melcher-Dallas | City | 1,195 |
| 5 | Bussey | City | 387 |
| 6 | Harvey | City | 236 |
| 7 | Hamilton | City | 119 |
| 8 | Swan | City | 76 |
| 9 | Marysville | City | 44 |
Gallery
-
 Marion County farmer with mule-drawn wagon, about 1926
 -
 Two Iowa farm boys riding a pony, around 1937
 -
 Iowa farm boy riding hog, about 1941
 -
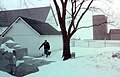
 Farm house and barn yard near Pleasantville, 1957
 -
 Cows in farm pasture, 1957
 -
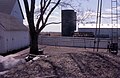
 Farmer getting coal, December 1957
 -
 Farm barnyard
 -
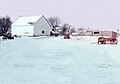
 Farm barnyard and silo, 1960


Politics
| Year | Republican | Democratic | Third party(ies) | |||
|---|---|---|---|---|---|---|
| No. | % | No. | % | No. | % | |
| 1880 | 2,452 | 47.46% | 1,520 | 29.42% | 1,194 | 23.11% |
| 1884 | 2,356 | 47.27% | 2,593 | 52.03% | 35 | 0.70% |
| 1888 | 2,374 | 47.30% | 2,322 | 46.26% | 323 | 6.44% |
| 1892 | 2,319 | 43.70% | 2,540 | 47.86% | 448 | 8.44% |
| 1896 | 2,741 | 46.05% | 3,119 | 52.40% | 92 | 1.55% |
| 1900 | 2,950 | 48.53% | 2,950 | 48.53% | 179 | 2.94% |
| 1904 | 2,988 | 53.05% | 2,202 | 39.10% | 442 | 7.85% |
| 1908 | 2,625 | 46.12% | 2,739 | 48.12% | 328 | 5.76% |
| 1912 | 1,191 | 22.66% | 2,276 | 43.31% | 1,788 | 34.02% |
| 1916 | 2,459 | 42.90% | 3,094 | 53.98% | 179 | 3.12% |
| 1920 | 5,435 | 56.62% | 3,861 | 40.22% | 303 | 3.16% |
| 1924 | 5,058 | 47.65% | 2,383 | 22.45% | 3,174 | 29.90% |
| 1928 | 6,225 | 59.36% | 4,113 | 39.22% | 149 | 1.42% |
| 1932 | 3,695 | 33.49% | 7,067 | 64.05% | 272 | 2.47% |
| 1936 | 4,975 | 41.51% | 6,745 | 56.27% | 266 | 2.22% |
| 1940 | 5,763 | 45.19% | 6,915 | 54.22% | 75 | 0.59% |
| 1944 | 4,874 | 42.99% | 6,365 | 56.14% | 99 | 0.87% |
| 1948 | 4,312 | 39.67% | 6,300 | 57.96% | 258 | 2.37% |
| 1952 | 7,165 | 57.25% | 5,196 | 41.51% | 155 | 1.24% |
| 1956 | 6,830 | 56.13% | 5,316 | 43.69% | 22 | 0.18% |
| 1960 | 7,444 | 61.99% | 4,547 | 37.87% | 17 | 0.14% |
| 1964 | 3,903 | 32.96% | 7,911 | 66.80% | 28 | 0.24% |
| 1968 | 5,791 | 52.35% | 4,618 | 41.75% | 653 | 5.90% |
| 1972 | 6,583 | 57.09% | 4,643 | 40.27% | 305 | 2.65% |
| 1976 | 5,429 | 45.79% | 6,226 | 52.51% | 202 | 1.70% |
| 1980 | 6,665 | 49.30% | 5,490 | 40.61% | 1,363 | 10.08% |
| 1984 | 7,259 | 53.24% | 6,313 | 46.30% | 62 | 0.45% |
| 1988 | 5,914 | 45.65% | 6,922 | 53.44% | 118 | 0.91% |
| 1992 | 6,062 | 44.79% | 5,531 | 40.87% | 1,940 | 14.34% |
| 1996 | 6,100 | 46.74% | 5,978 | 45.80% | 974 | 7.46% |
| 2000 | 8,358 | 58.01% | 5,741 | 39.85% | 309 | 2.14% |
| 2004 | 9,990 | 59.83% | 6,574 | 39.37% | 132 | 0.79% |
| 2008 | 9,256 | 54.34% | 7,421 | 43.57% | 355 | 2.08% |
| 2012 | 9,828 | 55.57% | 7,507 | 42.44% | 352 | 1.99% |
| 2016 | 10,962 | 61.53% | 5,482 | 30.77% | 1,372 | 7.70% |
| 2020 | 12,663 | 65.84% | 6,178 | 32.12% | 391 | 2.03% |
| 2024 | 13,289 | 67.92% | 5,928 | 30.30% | 349 | 1.78% |
See also
References
- ^ "Iowa County Names and Numbers". Iowa Department of Administrative Services. Retrieved February 9, 2026.
- ^ a b "2020 Census State Redistricting Data". census.gov. United states Census Bureau. Retrieved August 12, 2021.
- ^ "Find a County". National Association of Counties. Retrieved February 9, 2026.
- ^ Gannett, Henry (1905). The Origin of Certain Place Names in the United States. U.S. Government Printing Office. p. 200.
- ^ "US Gazetteer files: 2010, 2000, and 1990". United States Census Bureau. February 12, 2011. Retrieved April 23, 2011.
- ^ "County Population Totals and Components of Change: 2020-2024". Retrieved July 24, 2025.
- ^ "U.S. Decennial Census". United States Census Bureau. Retrieved January 7, 2014.
- ^ "Historical Census Browser". University of Virginia Library. 2007. Archived from the original on December 12, 2009. Retrieved January 7, 2014.
- ^ Forstall, Richard L. (April 20, 1995). "Population of Counties by Decennial Census: 1900 to 1990". United States Census Bureau. Archived from the original on February 19, 1999. Retrieved January 7, 2014.
- ^ "Census 2000 PHC-T-4. Ranking Tables for Counties: 1990 and 2000" (PDF). United States Census Bureau. Archived (PDF) from the original on March 27, 2010. Retrieved January 7, 2014.
- ^ "U.S. Census Bureau QuickFacts: Marion County, Iowa". www.census.gov. Retrieved February 9, 2026.
- ^ a b c "2020 Decennial Census Demographic Profile (DP1)". United States Census Bureau. 2021. Retrieved December 25, 2025.
- ^ "2020 Decennial Census Redistricting Data (Public Law 94-171)". United States Census Bureau. 2021. Retrieved December 25, 2025.
- ^ "2020 Decennial Census Demographic and Housing Characteristics (DHC)". United States Census Bureau. 2023. Retrieved December 25, 2025.
- ^ "Population & Housing Occupancy Status 2010" (PDF). United States Census Bureau American FactFinder. Archived (PDF) from the original on October 16, 2020. Retrieved August 15, 2022.
- ^ Leip, David. "Dave Leip's Atlas of U.S. Presidential Elections". uselectionatlas.org. Retrieved April 27, 2018.
External links
Places adjacent to Marion County, Iowa | ||||||||||||||||
|---|---|---|---|---|---|---|---|---|---|---|---|---|---|---|---|---|
| ||||||||||||||||
Municipalities and communities of Marion County, Iowa, United States | ||
|---|---|---|
| Cities | 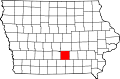 | |
| Unincorporated communities | ||
| Footnotes | ‡This populated place also has portions in an adjacent county or counties | |
| International | |
|---|---|
| National | |
| Other | |