


Adur District Council elections
Half of Adur District Council in West Sussex, England is elected every two years. Until 2003, the council was elected by thirds. Since the last boundary changes in 2004, 29 councillors have been elected from 14 wards.[1]
Council elections
| Year | Conservative | Labour | Liberal Democrats[a] | Green[b] | UKIP | Independents & Others |
Council control after election | |
|---|---|---|---|---|---|---|---|---|
| Local government reorganisation; council established (37 seats) | ||||||||
| 1973 | 13 | 6 | 16 | – | – | 2 | No overall control | |
| 1976 | 16 | 2 | 17 | 0 | – | 2 | No overall control | |
| New ward boundaries (39 seats) | ||||||||
| 1979 | 20 | 0 | 17 | 0 | – | 2 | Conservative | |
| 1980 | 16 | 1 | 20 | 0 | – | 2 | Liberal | |
| 1982 | 15 | 1 | 21 | 0 | – | 2 | Alliance | |
| 1983 | 17 | 1 | 19 | 0 | – | 2 | No overall control | |
| 1984 | 19 | 0 | 18 | 0 | – | 2 | No overall control | |
| 1986 | 15 | 0 | 22 | 0 | – | 2 | Alliance | |
| 1987 | 15 | 0 | 22 | 0 | – | 2 | Alliance | |
| 1988 | 15 | 0 | 22 | 0 | – | 2 | SLD | |
| 1990 | 14 | 1 | 22 | 0 | – | 2 | Liberal Democrats | |
| 1991 | 14 | 1 | 22 | 0 | – | 2 | Liberal Democrats | |
| 1992 | 14 | 1 | 22 | 0 | – | 2 | Liberal Democrats | |
| 1994 | 11 | 1 | 25 | 0 | 0 | 2 | Liberal Democrats | |
| 1995 | 5 | 3 | 29 | 0 | 0 | 2 | Liberal Democrats | |
| 1996 | 2 | 6 | 29 | 0 | 0 | 2 | Liberal Democrats | |
| 1998 | 5 | 10 | 22 | 0 | 0 | 2 | Liberal Democrats | |
| 1999 | 8 | 15 | 13 | 0 | 0 | 3[c] | No overall control | |
| 2000 | 15 | 13 | 9 | 0 | 0 | 2 | No overall control | |
| 2002 | 23 | 11 | 1 | 0 | – | 4 | Conservative | |
| 2003 | 27 | 8 | 0 | 0 | 0 | 4 | Conservative | |
| New ward boundaries (39 seats)[d] | ||||||||
| 2004 | 24 | 2 | 1 | 0 | 0 | 2 | Conservative | |
| 2006 | 26 | 0 | 1 | 0 | 0 | 2 | Conservative | |
| 2008 | 26 | 0 | 1 | 0 | 0 | 2 | Conservative | |
| 2010 | 25 | 0 | 2 | 0 | 0 | 2 | Conservative | |
| 2012 | 25 | 1 | 1 | 0 | 0 | 2 | Conservative | |
| 2014 | 20 | 1 | 0 | 0 | 5 | 3 | Conservative | |
| 2016 | 16 | 3 | 0 | 0 | 8 | 2 | Conservative | |
| 2018 | 16 | 7 | 0 | 0 | 3 | 2 | Conservative | |
| 2021 | 19 | 7 | 0 | 1 | 0 | 2 | Conservative | |
| 2022 | 16 | 9 | 0 | 2 | 0 | 2 | Conservative | |
| 2024 | 8 | 17 | 0 | 2 | 0 | 2 | Labour | |
| 2026 | ||||||||
- 1973 Adur District Council election
- 1976 Adur District Council election
- 1979 Adur District Council election (New ward boundaries)[3]
- 1980 Adur District Council election
- 1982 Adur District Council election
- 1983 Adur District Council election
- 1984 Adur District Council election
- 1986 Adur District Council election (District boundary changes took place but the number of seats remained the same)[4]
- 1987 Adur District Council election
- 1988 Adur District Council election
- 1990 Adur District Council election
- 1991 Adur District Council election
- 1992 Adur District Council election
- 1994 Adur District Council election (District boundary changes took place but the number of seats remained the same)[5]
- 1995 Adur District Council election
- 1996 Adur District Council election
- 1998 Adur District Council election
- 1999 Adur District Council election
- 2000 Adur District Council election
- 2002 Adur District Council election
- 2003 Adur District Council election
- 2004 Adur District Council election (New ward boundaries reduced the number of seats by 10)[6][7]
- 2006 Adur District Council election
- 2008 Adur District Council election
- 2010 Adur District Council election
- 2012 Adur District Council election
- 2014 Adur District Council election
- 2016 Adur District Council election
- 2018 Adur District Council election
- 2021 Adur District Council election
- 2022 Adur District Council election
- 2024 Adur District Council election
- 2026 Adur District Council election
District result maps
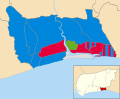
-
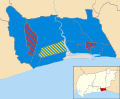 2004 results map
 -
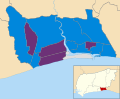
 2006 results map
 -
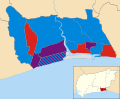
 2008 results map
 -
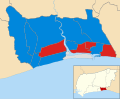
 2010 results map
 -
 2012 results map
 -
 2014 results map
 -
 2016 results map
 -
 2018 results map
 -
 2021 results map
 -
 2022 results map
 -
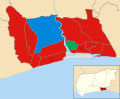 2024 results map


By-election results
1994-1998
| Party | Candidate | Votes | % | ±% | |
|---|---|---|---|---|---|
| Liberal Democrats | 967 | 37.5 | −2.4 | ||
| Labour | 821 | 31.8 | −14.9 | ||
| Conservative | 790 | 30.6 | +17.2 | ||
| Majority | 146 | 5.7 | |||
| Turnout | 2,578 | ||||
| Liberal Democrats hold | Swing | ||||
| Party | Candidate | Votes | % | ±% | |
|---|---|---|---|---|---|
| Liberal Democrats | 1,066 | 38.3 | −20.5 | ||
| Conservative | 1,062 | 38.2 | +15.5 | ||
| Labour | 652 | 23.5 | +4.9 | ||
| Majority | 4 | 0.1 | |||
| Turnout | 2,780 | ||||
| Liberal Democrats hold | Swing | ||||
| Party | Candidate | Votes | % | ±% | |
|---|---|---|---|---|---|
| Conservative | 1,192 | 39.3 | +7.6 | ||
| Liberal Democrats | 924 | 30.5 | −7.2 | ||
| Labour | 916 | 30.2 | −0.4 | ||
| Majority | 268 | 8.8 | |||
| Turnout | 3,032 | ||||
| Conservative gain from Liberal Democrats | Swing | ||||
1998-2002
| Party | Candidate | Votes | % | ±% | |
|---|---|---|---|---|---|
| Conservative | 425 | 35.6 | −4.5 | ||
| Liberal Democrats | 423 | 35.4 | −10.1 | ||
| Labour | 346 | 29.0 | +14.7 | ||
| Majority | 2 | 0.2 | |||
| Turnout | 1,194 | ||||
| Conservative gain from Liberal Democrats | Swing | ||||
| Party | Candidate | Votes | % | ±% | |
|---|---|---|---|---|---|
| Conservative | 738 | 50.3 | +10.4 | ||
| Labour | 589 | 40.2 | −4.7 | ||
| Liberal Democrats | 139 | 9.5 | −5.7 | ||
| Majority | 149 | 10.1 | |||
| Turnout | 1,466 | 34.6 | |||
| Conservative gain from Labour | Swing | ||||
| Party | Candidate | Votes | % | ±% | |
|---|---|---|---|---|---|
| Conservative | Angela Mills | 886 | 41.9 | +3.1 | |
| Liberal Democrats | Shirely Rance | 802 | 38.0 | −10.9 | |
| Labour | Ronald Horne | 425 | 21.1 | −7.8 | |
| Majority | 84 | 3.9 | |||
| Turnout | 2,113 | 64.0 | |||
| Conservative gain from Liberal Democrats | Swing | ||||
| Party | Candidate | Votes | % | ±% | |
|---|---|---|---|---|---|
| Conservative | Andrew McGregor | 761 | 40.0 | −1.5 | |
| Liberal Democrats | Barrie Marler | 617 | 32.4 | +2.7 | |
| Labour | Jeanette White | 525 | 27.6 | −1.2 | |
| Majority | 144 | 7.6 | |||
| Turnout | 1,903 | 60.7 | |||
| Conservative gain from Liberal Democrats | Swing | ||||
| Party | Candidate | Votes | % | ±% | |
|---|---|---|---|---|---|
| Conservative | Iris Hayward | 895 | 38.9 | −0.6 | |
| Liberal Democrats | Anthony Stuart | 720 | 31.3 | −1.3 | |
| Labour | Teana Ashley | 686 | 29.8 | +2.0 | |
| Majority | 175 | 7.6 | |||
| Turnout | 2,301 | 61.1 | |||
| Conservative gain from Labour | Swing | ||||
2002-2006
| Party | Candidate | Votes | % | ±% | |
|---|---|---|---|---|---|
| Conservative | Sara Hall | 368 | 50.5 | −5.9 | |
| Liberal Democrats | Roy Gibson | 213 | 29.2 | +29.2 | |
| Labour | Ann Bridges | 148 | 20.3 | −12.4 | |
| Majority | 155 | 21.3 | |||
| Turnout | 729 | 18.8 | |||
| Conservative hold | Swing | ||||
| Party | Candidate | Votes | % | ±% | |
|---|---|---|---|---|---|
| Independent | Keith Fayers-Morrisey | 1,190 | 62.3 | ||
| Liberal Democrats | Doris Martin | 404 | 21.2 | ||
| Labour | Daniel Yates | 316 | 16.5 | ||
| Majority | 786 | 41.1 | |||
| Turnout | 1,910 | 64.0 | |||
| Independent hold | Swing | ||||
2006-2010
| Party | Candidate | Votes | % | ±% | |
|---|---|---|---|---|---|
| Conservative | Angus Dunn | 445 | 59.1 | −0.2 | |
| Liberal Democrats | Clive Connor | 184 | 24.4 | +2.7 | |
| Labour | Barry Thompson | 124 | 16.5 | −2.5 | |
| Majority | 261 | 34.7 | |||
| Turnout | 753 | 22.0 | |||
| Conservative hold | Swing | ||||
2010-2014
| Party | Candidate | Votes | % | ±% | |
|---|---|---|---|---|---|
| Conservative | Nicholas Pigott | 288 | 39.6 | −15.6 | |
| Labour | Barry Mear | 282 | 38.8 | +13.6 | |
| UKIP | David Bamber | 91 | 12.5 | +12.5 | |
| Green | Jennie Tindall | 35 | 4.8 | +4.8 | |
| Liberal Democrats | Cyril Cannings | 31 | 4.3 | −15.3 | |
| Majority | 6 | 0.8 | −29.2 | ||
| Turnout | 730 | 21.4 | −9.6 | ||
| Conservative hold | Swing | -14.6 | |||
| Party | Candidate | Votes | % | ±% | |
|---|---|---|---|---|---|
| UKIP | Paul Graysmark | 354 | 39.9 | +24.8 | |
| Labour | Andy Bray | 254 | 28.6 | −8.5 | |
| Conservative | Vicky Parkin | 228 | 25.7 | −12.3 | |
| Liberal Democrats | Cyril Cannings | 51 | 5.7 | −4.1 | |
| Majority | 100 | 11.3 | |||
| Turnout | 887 | ||||
| UKIP gain from Conservative | Swing | ||||
Paul Graysmark was elected in 2012 for the Conservatives; he resigned to seek re-election as a UKIP candidate.
2014-2018
| Party | Candidate | Votes | % | ±% | |
|---|---|---|---|---|---|
| Conservative | Stephen Chipp | 340 | 38.4 | +1.3 | |
| Labour | Irene Reed | 223 | 25.2 | +2.6 | |
| UKIP | Jenny Greig | 216 | 24.4 | +3.3 | |
| Green | Jennie Tindall | 106 | 12.0 | −0.7 | |
| Majority | 117 | 13.2 | |||
| Turnout | 885 | ||||
| Conservative hold | Swing | ||||
| Party | Candidate | Votes | % | ±% | |
|---|---|---|---|---|---|
| Labour | Lee Cowen | 490 | 49.3 | +29.7 | |
| Conservative | Jack Howard | 384 | 38.6 | +16.0 | |
| Liberal Democrats | Doris Martin | 89 | 9.0 | −6.5 | |
| Green | Paul Hendy | 31 | 3.1 | +3.1 | |
| Majority | 106 | 10.7 | |||
| Turnout | 994 | ||||
| Labour gain from UKIP | Swing | ||||
2018-2022
| Party | Candidate | Votes | % | ±% | |
|---|---|---|---|---|---|
| Labour | Debs Stainforth | 448 | 45.9 | +4.1 | |
| Green | Andrew Bradbury | 395 | 40.5 | +34.9 | |
| Conservative | Tony Nicklen | 132 | 13.5 | −27.2 | |
| Majority | 53 | 5.4 | |||
| Turnout | 975 | ||||
| Labour gain from UKIP | Swing | ||||
| Party | Candidate | Votes | % | ±% | |
|---|---|---|---|---|---|
| Conservative | Leila Williams | 414 | 56.2 | ||
| Green | Russell Whiting | 175 | 23.7 | ||
| Labour | Rebecca Allinson | 148 | 20.1 | ||
| Majority | 239 | 32.4 | |||
| Turnout | 737 | ||||
| Conservative hold | Swing | ||||
2022-2026
| Party | Candidate | Votes | % | ±% | |
|---|---|---|---|---|---|
| Labour | Kate Davis | 609 | 43.6 | −7.3 | |
| Reform | Mike Mendoza | 311 | 22.3 | +22.3 | |
| Conservative | Leila Williams | 301 | 21.6 | −10.1 | |
| Liberal Democrats | Ian Jones | 153 | 11.0 | −1.3 | |
| Britain First | David Bamber | 22 | 1.6 | +1.6 | |
| Majority | 298 | 21.3 | |||
| Turnout | 1,396 | ||||
| Labour hold | Swing | ||||
Notes
- ^ Includes totals for the predecessors of the Liberal Democrats, the Liberal Party and SDP (both of which participated in the Alliance).
- ^ Includes totals for the predecessors of the Green Party of England and Wales, the Ecology Party and Green Party UK.
- ^ Including 1 vacant seat
- ^ Changed from one-third to half council elections
References
- ^ "Your councillors". Adur District Council. November 2005. Retrieved 21 October 2009.
- ^ "Composition calculator". Colin Rallings & Michael Thrasher. The Elections Centre, Plymouth University. Retrieved 14 May 2025.
- ^ The District of Adur (Electoral Arrangements) Order 1978
- ^ The Adur, Arun and Worthing (Areas) Order 1985
- ^ legislation.gov.uk - The East Sussex, West Sussex and Kent (County Boundaries) Order 1992. Retrieved on 5 November 2015.
- ^ "Adur". * BBC News Online. Retrieved 3 May 2008.
- ^ legislation.gov.uk - The District of Adur (Electoral Changes) Order 2002. Retrieved on 4 October 2015.
- ^ "Marine ward by-election" (PDF). Adur District Council. Retrieved 26 July 2011.
- ^ "Welsh council victory for Labour". guardian.co.uk. 15 September 2006. Retrieved 21 October 2009.
- ^ "Declaration of Result: Cokeham Ward By Election" (PDF). Adur District Council. 18 October 2011. Retrieved 19 October 2011.
- ^ "Local Elections Archive Project — Southlands Ward". www.andrewteale.me.uk. Retrieved 21 April 2022.
- ^ "Local Elections Archive Project — St Mary's Ward". www.andrewteale.me.uk. Retrieved 21 April 2022.
- ^ "Local Elections Archive Project — Mash Barn Ward". www.andrewteale.me.uk. Retrieved 21 April 2022.
- ^ "Local Elections Archive Project — Southlands Ward". www.andrewteale.me.uk. Retrieved 21 April 2022.
- ^ "Local Elections Archive Project — Hillside Ward". www.andrewteale.me.uk. Retrieved 21 April 2022.
- ^ "Local Elections Archive Project — Buckingham Ward". www.andrewteale.me.uk. Retrieved 8 August 2025.
- By-election results Archived 29 March 2010 at the Wayback Machine
External links
| West Sussex CC | |
|---|---|
| Adur | |
| Arun | |
| Chichester | |
| Crawley | |
| Horsham | |
| Mid Sussex | |
| Worthing | |
| |