


Kanawha County, West Virginia
Kanawha County, West Virginia | |
|---|---|
 Kanawha County Courthouse in Charleston | |
 Flag  Seal | |
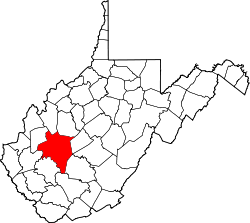
 Location within the U.S. state of West Virginia | |
| Coordinates: 38°20′N 81°32′W / 38.34°N 81.53°W | |
| Country | |
| State | |
| Founded | October 5, 1789 |
| Named after | Kanawha River |
| Seat | Charleston |
| Largest city | Charleston |
| Area | |
• Total | 911 sq mi (2,360 km2) |
| • Land | 902 sq mi (2,340 km2) |
| • Water | 9.3 sq mi (24 km2) 1.0% |
| Population (2020) | |
• Total | 180,745 |
• Estimate (2023) | 174,805 |
| • Density | 200/sq mi (77.4/km2) |
| Time zone | UTC−5 (Eastern) |
| • Summer (DST) | UTC−4 (EDT) |
| Congressional district | 1st |
| Website | www |
Kanawha County (/kəˈnɔːə/ kə-NAW-ə) is a county in the U.S. state of West Virginia. As of the 2020 census, the population was 180,745,[1] making it West Virginia's most populous county.[2] The county seat is Charleston,[3] which is also the state capital and most populous city. Kanawha County is part of the Charleston, WV Metropolitan Statistical Area.
History
The word Kanawha (pronounced "Ka-NAH-wah"), Ka(h)nawha, derives from the region's Iroquoian dialects, meaning "water way" or "Canoe Way", implying the metaphor "transport way". Kanawha County was named in honor of the Kanawha River that runs through the county. The spelling varied at the time from Conoys to Conois to Kanawha.[4] The phrase has been a matter of register. A two-story jail was the first county structure to be built, with the first floor dug into the bank of the Kanawha River.
The county began taking shape on November 14, 1788, under the authorization of the Virginia General Assembly, and was founded on October 5, 1789. The county was named for the Kanawha River. During the American Civil War, a number of state infantry and cavalry regiments were organized in the county for both Confederate Army and Union Army service.
In 1863, West Virginia's counties were divided into civil townships, with the intention of encouraging local government. This proved impractical in the heavily rural state, and in 1872 the townships were converted into magisterial districts.[5] Kanawha County was divided into ten districts: Big Sandy, Cabin Creek, Charleston, Elk, Jefferson, Loudon, Malden, Poca,[i] Union, and Washington. In the 1970s, the historic districts were consolidated into five new magisterial districts: District 1, District 2, District 3, District 4, and District 5. A District 6 was created in the 1980s, but in the 1990s the county was redistricted again, reducing the number of magisterial districts to four: District 1, District 2, District 3, and District 4.[6]
Kanawha County was the site of a bloody miners' strike in 1912, and a school textbook controversy in 1974, that resulted in bombings, and received national attention.
Geography
According to the United States Census Bureau, the county has a total area of 911 square miles (2,360 km2), of which 902 square miles (2,340 km2) is land and 9.3 square miles (24 km2) (1.0%) is water.[7] It is the fourth-largest county in West Virginia by area.
Adjacent counties
- Roane County (north)
- Clay County (northeast)
- Nicholas County (east)
- Fayette County (east)
- Raleigh County (southeast)
- Boone County (south)
- Lincoln County (southwest)
- Putnam County (west)
- Jackson County (northwest)
Major highways
 Interstate 64
 Interstate 77
 Interstate 79
 U.S. Route 60
 U.S. Route 119
 West Virginia Route 4
 West Virginia Route 25
 West Virginia Route 34
 West Virginia Route 61
 West Virginia Route 62
 West Virginia Route 94
 West Virginia Route 114
 West Virginia Route 214
 West Virginia Route 501
 West Virginia Route 601
 West Virginia Route 622
 West Virginia Route 817
Demographics
| Census | Pop. | Note | %± |
|---|---|---|---|
| 1800 | 3,239 | — | |
| 1810 | 3,866 | 19.4% | |
| 1820 | 6,399 | 65.5% | |
| 1830 | 9,326 | 45.7% | |
| 1840 | 13,567 | 45.5% | |
| 1850 | 15,353 | 13.2% | |
| 1860 | 16,150 | 5.2% | |
| 1870 | 22,349 | 38.4% | |
| 1880 | 32,466 | 45.3% | |
| 1890 | 42,756 | 31.7% | |
| 1900 | 54,696 | 27.9% | |
| 1910 | 81,457 | 48.9% | |
| 1920 | 119,650 | 46.9% | |
| 1930 | 157,667 | 31.8% | |
| 1940 | 195,619 | 24.1% | |
| 1950 | 239,629 | 22.5% | |
| 1960 | 252,925 | 5.5% | |
| 1970 | 229,515 | −9.3% | |
| 1980 | 231,414 | 0.8% | |
| 1990 | 207,619 | −10.3% | |
| 2000 | 200,073 | −3.6% | |
| 2010 | 193,063 | −3.5% | |
| 2020 | 180,745 | −6.4% | |
| 2023 (est.) | 174,805 | [8] | −3.3% |
| U.S. Decennial Census[9] 1790–1960[10] 1900–1990[11] 1990–2000[12] 2010–2020[1] | |||
2020 census
As of the 2020 census, the county had a population of 180,745. Of the residents, 19.6% were under the age of 18 and 21.4% were 65 years of age or older; the median age was 44.1 years. For every 100 females there were 93.2 males, and for every 100 females age 18 and over there were 90.8 males.[13][14]
There were 79,365 households in the county, of which 25.0% had children under the age of 18 living with them and 31.7% had a female householder with no spouse or partner present. About 34.2% of all households were made up of individuals and 15.0% had someone living alone who was 65 years of age or older.[13]
There were 90,294 housing units, of which 12.1% were vacant. Among occupied housing units, 67.7% were owner-occupied and 32.3% were renter-occupied. The homeowner vacancy rate was 2.5% and the rental vacancy rate was 11.1%.[13]
The racial makeup of the county was 85.0% White, 7.5% Black or African American, 0.2% American Indian and Alaska Native, 1.2% Asian, 0.7% from some other race, and 5.3% from two or more races. Hispanic or Latino residents of any race comprised 1.5% of the population.[14]
The average household and family size was 2.89.[13]
The median income for a household was $56,112 and the poverty rate was 15.8%[15]
| Race / Ethnicity (NH = Non-Hispanic) | Pop 2000[16] | Pop 2010[17] | Pop 2020[18] | % 2000 | % 2010 | % 2020 |
|---|---|---|---|---|---|---|
| White alone (NH) | 180,258 | 170,969 | 152,735 | 90.09% | 88.55% | 84.50% |
| Black or African American alone (NH) | 13,870 | 13,950 | 13,416 | 6.93% | 7.22% | 7.42% |
| Native American or Alaska Native alone (NH) | 401 | 388 | 357 | 0.20% | 0.20% | 0.19% |
| Asian alone (NH) | 1,687 | 1,982 | 2,138 | 0.84% | 1.02% | 1.18% |
| Pacific Islander alone (NH) | 34 | 37 | 47 | 0.01% | 0.01% | 0.02% |
| Other race alone (NH) | 205 | 207 | 733 | 0.10% | 0.10% | 0.40% |
| Mixed race or Multiracial (NH) | 2,446 | 3,718 | 8,599 | 1.22% | 1.92% | 4.75% |
| Hispanic or Latino (any race) | 1,172 | 1,812 | 2,720 | 0.58% | 0.93% | 1.50% |
| Total | 200,073 | 193,063 | 180,745 | 100.00% | 100.00% | 100.00% |
2010 census
As of the 2010 United States census, there were 193,063 people, 84,201 households, and 52,172 families living in the county.[19] The population density was 214.1 inhabitants per square mile (82.7/km2). There were 92,618 housing units at an average density of 102.7 units per square mile (39.7 units/km2).[20] The racial makeup of the county was 89.1% white, 7.3% black or African American, 1.0% Asian, 0.2% American Indian, 0.3% from other races, and 2.0% from two or more races. Those of Hispanic or Latino origin made up 0.9% of the population.[19] In terms of ancestry, 14.8% were German, 14.2% were Irish, 13.9% were English, and 13.4% were American.[21]
Of the 84,201 households, 27.1% had children under the age of 18 living with them, 44.3% were married couples living together, 13.1% had a female householder with no husband present, 38.0% were non-families, and 32.5% of all households were made up of individuals. The average household size was 2.26 and the average family size was 2.84. The median age was 42.4 years.[19]
The median income for a household in the county was $42,669 and the median income for a family was $54,203. Males had a median income of $42,522 versus $31,754 for females. The per capita income for the county was $25,439. About 9.7% of families and 13.7% of the population were below the poverty line, including 20.5% of those under age 18 and 8.3% of those age 65 or over.[22]
2000 census
As of the census[23] of 2000, there were 200,073 people, 86,226 households, and 55,960 families living in the county. The population density was 222 people per square mile (86 people/km2). There were 93,788 housing units at an average density of 104 units per square mile (40 units/km2). The racial makeup of the county was 90.46% White, 6.97% Black or African American, 0.21% Native American, 0.85% Asian, 0.02% Pacific Islander, 0.21% from other races, and 1.27% from two or more races. 0.59% of the population were Hispanics or Latinos of any race.
There were 86,226 households, out of which 26.50% had children under the age of 18 living with them, 49.00% were married couples living together, 12.30% had a female householder with no husband present, and 35.10% were non-families. 30.80% of all households were made up of individuals, and 12.50% had someone living alone who was 65 years of age or older. The average household size was 2.28 and the average family size was 2.84.
The age distribution was 21.30% under the age of 18, 8.40% from 18 to 24, 28.10% from 25 to 44, 25.60% from 45 to 64, and 16.50% who were 65 years of age or older. The median age was 40 years. For every 100 females, there were 90.70 males. For every 100 females age 18 and over, there were 87.10 males.
The median income for a household in the county was $33,766, and the median income for a family was $42,568. Males had a median income of $33,842 versus $24,188 for females. The per capita income for the county was $20,354. About 11.20% of families and 14.40% of the population were below the poverty line, including 20.60% of those under age 18 and 10.50% of those age 65 or over.
Politics
Kanawha County was dominated by the Democratic Party for much of the 20th century, albeit to a lesser extent than much of West Virginia. Since 2004 it has been won by Republicans in presidential elections, although, as an urban county, the swing to the Republicans has not been as vast as in much of the rest of the state. The county seat and state capital of Charleston was once heavily Democratic, but now leans Republican as a whole.
| Year | Republican | Democratic | Third party(ies) | |||
|---|---|---|---|---|---|---|
| No. | % | No. | % | No. | % | |
| 1880 | 2,112 | 34.66% | 2,378 | 39.02% | 1,604 | 26.32% |
| 1884 | 4,240 | 58.99% | 2,820 | 39.23% | 128 | 1.78% |
| 1888 | 4,541 | 54.66% | 3,089 | 37.19% | 677 | 8.15% |
| 1892 | 5,078 | 51.17% | 4,549 | 45.84% | 296 | 2.98% |
| 1896 | 6,948 | 58.65% | 4,824 | 40.72% | 75 | 0.63% |
| 1900 | 7,249 | 60.17% | 4,736 | 39.31% | 63 | 0.52% |
| 1904 | 8,857 | 58.62% | 5,756 | 38.10% | 495 | 3.28% |
| 1908 | 9,663 | 54.43% | 7,117 | 40.09% | 974 | 5.49% |
| 1912 | 1,780 | 9.96% | 6,658 | 37.26% | 9,431 | 52.78% |
| 1916 | 10,096 | 48.14% | 10,276 | 49.00% | 598 | 2.85% |
| 1920 | 23,781 | 54.33% | 19,284 | 44.06% | 704 | 1.61% |
| 1924 | 26,018 | 49.14% | 22,726 | 42.92% | 4,207 | 7.95% |
| 1928 | 35,788 | 58.16% | 25,563 | 41.54% | 184 | 0.30% |
| 1932 | 35,455 | 47.39% | 38,617 | 51.61% | 749 | 1.00% |
| 1936 | 35,387 | 41.00% | 50,801 | 58.86% | 113 | 0.13% |
| 1940 | 40,113 | 40.91% | 57,932 | 59.09% | 0 | 0.00% |
| 1944 | 36,488 | 43.50% | 47,400 | 56.50% | 0 | 0.00% |
| 1948 | 41,144 | 43.45% | 53,213 | 56.19% | 338 | 0.36% |
| 1952 | 56,861 | 51.04% | 54,540 | 48.96% | 0 | 0.00% |
| 1956 | 58,597 | 53.81% | 50,289 | 46.19% | 0 | 0.00% |
| 1960 | 57,130 | 51.19% | 54,484 | 48.81% | 0 | 0.00% |
| 1964 | 38,383 | 35.25% | 70,511 | 64.75% | 0 | 0.00% |
| 1968 | 41,712 | 41.76% | 46,650 | 46.70% | 11,524 | 11.54% |
| 1972 | 65,021 | 63.09% | 38,032 | 36.91% | 0 | 0.00% |
| 1976 | 42,213 | 44.06% | 53,602 | 55.94% | 0 | 0.00% |
| 1980 | 42,604 | 46.43% | 42,829 | 46.68% | 6,327 | 6.90% |
| 1984 | 51,499 | 57.51% | 37,832 | 42.25% | 211 | 0.24% |
| 1988 | 38,140 | 47.95% | 41,144 | 51.73% | 258 | 0.32% |
| 1992 | 31,358 | 38.40% | 38,315 | 46.91% | 11,998 | 14.69% |
| 1996 | 29,311 | 38.32% | 40,357 | 52.76% | 6,827 | 8.92% |
| 2000 | 36,809 | 48.01% | 38,524 | 50.25% | 1,337 | 1.74% |
| 2004 | 44,430 | 50.53% | 43,010 | 48.92% | 488 | 0.55% |
| 2008 | 40,952 | 49.65% | 40,594 | 49.22% | 934 | 1.13% |
| 2012 | 41,364 | 55.10% | 32,480 | 43.26% | 1,233 | 1.64% |
| 2016 | 43,850 | 57.03% | 28,263 | 36.76% | 4,775 | 6.21% |
| 2020 | 46,398 | 56.41% | 34,344 | 41.76% | 1,508 | 1.83% |
| 2024 | 43,352 | 57.39% | 30,231 | 40.02% | 1,955 | 2.59% |
Elected officials
| Agency | Elected Official |
|---|---|
| Kanawha County Commission | Commissioner Ben Salango, President Commissioner Natalie Tennant Commissioner Lance Wheeler |
| Kanawha County Assessor | Sallie Robinson |
| Kanawha County Circuit Clerk | Cathy Gatson |
| Kanawha County Clerk | Vera McCormick |
| Kanawha County Prosecutor | Charles "Chuck" Miller |
| Kanawha County Sheriff | Michael Y. Rutherford |
Economy
According to the 2010 U.S. Census, there are approximately 5,481 private sector businesses within Kanawha County. There are 89,768 people who are currently employed who live in Kanawha County.[26]
Recreation
| Parks | Golf |
|---|---|
| Coonskin Park | Coonskin Golf Course |
| Shawnee Park | Shawnee Golf Course |
| Meadowood Park | Edgewood Country Club |
| Pioneer Park | Little Creek Golf Course |
| Wallace Hartman Nature Preserve | Sleepy Hollow Golf Club |
| Cato Park | Sandy Brae Golf Course |
| Ridenour Park | Berry Hills Country Club |
| Big Bend Park | Big Bend Golf Course |
| Kanawha State Forest | |
| Saint Albans City Park |
Events
- FestivALL[27]
- Charleston Sternwheel Regatta (Returning 2022)
- Live on the Levee[28]
- Vandalia Gathering[29]
- Rib Fest[30]
- Charleston Rod Run Doo Wop[31]
- Majorette Festival - Daily Mail Kanawha County Majorette and Band Festival
- Pinch Reunion[32]
- St. Albans Festival of Lights[33]
Attractions
- Clay Center (West Virginia)
- West Virginia State Capitol
- West Virginia Cultural Center
- South Charleston Mound
- Mardi Gras Casino and Resort
- Charleston Civic Center
- Heritage Tower Museum
Sports
- Charleston Dirty Birds - Baseball team
- West Virginia United - Soccer club
Communities
Cities
- Charleston (county seat)
- Dunbar
- Marmet
- Montgomery (part)
- Nitro (part)
- Smithers (part)
- South Charleston
- St. Albans
Towns
Magisterial districts
- District 1
- District 2
- District 3
- District 4
Census-designated places
Unincorporated communities
- Aarons
- Acme
- Acup
- Airport Village
- Amandaville
- Amelia
- Annfred
- Arborland Acres
- Barren Creek
- Blackhawk
- Blakeley
- Blount
- Blue Creek
- Blundon
- Bream
- Brounland
- Burnwell
- Cabin Creek
- Carbon
- Cinco
- Coalburg
- Coalridge
- Coco
- Corton
- Crede
- Crown Hill
- Davis Creek
- Dawes
- Decota
- Dial
- Diamond
- Dickinson
- Donwood
- Dry Branch
- Dungriff
- East Nitro
- East Side
- Edgewood
- Elk
- Elk Forest
- Elk Hills
- Emmons (part)
- Etowah
- Falling Rock
- Ferrell
- Fivemile
- Forest Hills
- Forks of Coal
- Fort Hill
- Frame
- Gallagher
- Giles
- Green Valley
- Greencastle
- Grippe
- Guthrie
- Hansford
- Hernshaw
- Hicumbottom
- Highlawn
- Hillsdale
- Hitop
- Holly
- Hollyhurst
- Hugheston
- Island Branch
- Ivydale
- Jarrett
- Jarretts Ford
- Joplin
- Kanawha Estates
- Kayford
- Kelly Hill
- Kendalia
- Laing
- Leewood
- Loudendale
- Lower Falls
- Mammoth
- Meadowbrook
- Mink Shoals
- Pocatalico
- Pond Gap
- Port Amherst
- Putney
- Quick
- Quincy
- River Bend
- Rocky Fork
- Rock Lake Village
- Rutledge
- Sanderson
- Sharon
- Tyler Heights
- Tyler Mountain
Notable people
- Robert Alexander, NFL football player
- Anthony Bass, NFL football player
- George Crumb, composer
- Aaron Dobson, Super Bowl champion football player
- Ryan Dorsey, actor
- Jon Elmore, NBA basketball player
- Conchata Ferrell, actress best known for her role as Berta on Two and a Half Men
- Jennifer Garner, actress and Golden Globe and SAG award winner
- Elizabeth Harden Gilmore, business leader and civil rights advocate
- Gary Gregor, NBA basketball player
- Alex Hawkins, two-time NFL champion football player
- Alexis Hornbuckle, two-time WNBA champion basketball player
- T. D. Jakes, megachurch pastor
- Carl Lee, NFL football player
- Earl Lloyd, Basketball Hall of Fame inductee and the first African-American basketball player to play in an NBA game
- Kathy Mattea, country music and bluegrass singer
- Ann Magnuson is an American actress, performance artist, and nightclub performer.
- Renee Montgomery, two-time WNBA champion basketball player
- Randy Moss, Pro Football Hall of Fame inductee and holder of the NFL record for receiving touchdowns in a season
- Lou Myers, actor, best known for his role as Vernon Gaines on A Different World
- Les Palmer, NFL champion football player
- Phil Pfister, strongman competitor and winner of the 2006 World's Strongest Man competition
- Kristen Ruhlin, actress
- Ryan Switzer, NFL football player
- Booker T. Washington, highly influential educator, author, orator, presidential advisor, and co-founder of the Tuskegee Institute
- Jerry West, Basketball Hall of Fame inductee and the basis for the silhouette on the NBA logo since 1971
- Jason Williams, NBA basketball player
See also
- National Register of Historic Places listings in Kanawha County, West Virginia
- Kanawha County textbook controversy
Footnotes
- ^ Originally "Pocatalico".
References
- ^ a b "State & County QuickFacts". United States Census Bureau. Retrieved July 6, 2022.
- ^ Johnson, Shauna (March 25, 2016). "West Virginia losing more people than any other state". WV MetroNews. Retrieved February 9, 2021.
- ^ "Find a County". National Association of Counties. Archived from the original on May 31, 2011. Retrieved June 7, 2011.
- ^ "Kanawha County History". Archived from the original on June 16, 2010. Retrieved October 31, 2009. (December 29, 2008)
- ^ Otis K. Rice & Stephen W. Brown, West Virginia: A History, 2nd ed., University Press of Kentucky, Lexington (1993), p. 240.
- ^ United States Census Bureau, U.S. Decennial Census, Tables of Minor Civil Divisions in West Virginia, 1870–2010.
- ^ "2010 Census Gazetteer Files". United States Census Bureau. August 22, 2012. Retrieved July 24, 2015.
- ^ {{cite web|title=2023 Population Estimates (PEP)|url=https://api.census.gov/data/2023/pep/charv?get=NAME%2CPOP&for=county%3A039&in=state%3A54&MONTH=7&YEAR=2023&UNIVERSE=R&AGE=0000&SEX=0%7Cwebsite=United States Census Bureau|access-date=February 22, 2026|df=mdy}
- ^ "U.S. Decennial Census". United States Census Bureau. Retrieved January 10, 2014.
- ^ "Historical Census Browser". University of Virginia Library. Retrieved January 10, 2014.
- ^ "Population of Counties by Decennial Census: 1900 to 1990". United States Census Bureau. Retrieved January 10, 2014.
- ^ "Census 2000 PHC-T-4. Ranking Tables for Counties: 1990 and 2000" (PDF). United States Census Bureau. Archived (PDF) from the original on October 9, 2022. Retrieved January 10, 2014.
- ^ a b c d "2020 Decennial Census Demographic Profile (DP1)". United States Census Bureau. 2021. Retrieved 2025-12-01.
- ^ a b "2020 Decennial Census Redistricting Data (Public Law 94-171)". United States Census Bureau. 2021. Retrieved 2025-12-01.
- ^ "Explore Census Data". data.census.gov. Retrieved March 30, 2023.
- ^ "P004: Hispanic or Latino, and Not Hispanic or Latino by Race – 2000: DEC Summary File 1 – Kanawha County, West Virginia". United States Census Bureau.
- ^ "P2 Hispanic or Latino, and Not Hispanic or Latino by Race – 2010: DEC Redistricting Data (PL 94-171) - Kanawha County, West Virginia". United States Census Bureau.
- ^ "P2 Hispanic or Latino, and Not Hispanic or Latino by Race – 2020: DEC Redistricting Data (PL 94-171) - Kanawha County, West Virginia". United States Census Bureau.
- ^ a b c "DP-1 Profile of General Population and Housing Characteristics: 2010 Demographic Profile Data". United States Census Bureau. Archived from the original on February 13, 2020. Retrieved April 3, 2016.
- ^ "Population, Housing Units, Area, and Density: 2010 - County". United States Census Bureau. Archived from the original on February 13, 2020. Retrieved April 3, 2016.
- ^ "DP02 SELECTED SOCIAL CHARACTERISTICS IN THE UNITED STATES – 2006-2010 American Community Survey 5-Year Estimates". United States Census Bureau. Archived from the original on February 13, 2020. Retrieved April 3, 2016.
- ^ "DP03 SELECTED ECONOMIC CHARACTERISTICS – 2006-2010 American Community Survey 5-Year Estimates". United States Census Bureau. Archived from the original on February 13, 2020. Retrieved April 3, 2016.
- ^ "U.S. Census website". United States Census Bureau. Retrieved May 14, 2011.
- ^ Leip, David. "Dave Leip's Atlas of U.S. Presidential Elections". uselectionatlas.org. Retrieved March 27, 2018.
- ^ The leading "other" candidate, Progressive Theodore Roosevelt, received 3,071 votes, while Socialist candidate Eugene Debs received 1,780 votes.
- ^ "State & County QuickFacts". Archived from the original on June 7, 2011.
- ^ "Home | FestivAll". www.festivallcharleston.com. Retrieved March 27, 2018.
- ^ "Live on the Levee". liveontheleveecharleston.com. Retrieved March 27, 2018.
- ^ "Vandalia Gathering". www.wvculture.org. Retrieved March 27, 2018.
- ^ "South Charleston Convention & Visitors Bureau | 18th Annual Barbecue Ribfest". southcharlestonwv.org. Archived from the original on March 28, 2018. Retrieved March 27, 2018.
- ^ "2017 Charleston Rod Run & Doo Wop". www.charlestonwvcarshow.com. Retrieved March 27, 2018.
- ^ "WV MetroNews – Pinch Lays Claim To Oldest Reunion". wvmetronews.com. August 10, 2012. Retrieved March 27, 2018.
- ^ "Saint Albans Festival of Lights". Archived from the original on December 26, 2012. Retrieved February 28, 2013.
Further reading
- Scott A. MacKenzie. "The Slaveholders' War: The Secession Crisis in Kanawha County, Western Virginia, 1860-1861," West Virginia History: A Journal of Regional Studies - New Series, Volume 4, Number 1, Spring 2010, pp. 33–57 in Project MUSE
External links
- Kanawha County Commission
- Kanawha County Public Library
- Kanawha County Schools
- WVGenWeb Kanawha County
- Kanawha County Obituary Archive
- Convention & Visitors Bureau
- Charleston, WV - http://www.charlestonwv.com/
- Dunbar, WV - http://www.wvcommerce.org/travel/travelplanner/attraction/Dunbar-Convention-and-Visitors-Bureau-CVB/3843/default.aspx Archived February 7, 2011, at the Wayback Machine
- Nitro, WV - https://web.archive.org/web/20130727150319/http://nitrowvcvb.org/
- South Charleston, WV - https://web.archive.org/web/20121019071540/http://www.southcharlestonwv.org/SCCVB/Welcome.html
Places adjacent to Kanawha County, West Virginia | ||||||||||||||||
|---|---|---|---|---|---|---|---|---|---|---|---|---|---|---|---|---|
| ||||||||||||||||
38°20′N 81°32′W / 38.34°N 81.53°W
| International | |
|---|---|
| National | |
| Geographic | |
| Other | |