


Hinsdale County, Colorado
Hinsdale County, Colorado | |
|---|---|
 The 1877 Hinsdale County Court House in Lake City, Colorado. (photo taken 2018) | |
 Location within the U.S. state of Colorado | |
| Coordinates: 37°49′N 107°17′W / 37.82°N 107.28°W | |
| Country | |
| State | |
| Founded | February 10, 1874 |
| Named after | George A. Hinsdale |
| Seat | Lake City |
| Largest town | Lake City |
| Area | |
• Total | 1,123 sq mi (2,910 km2) |
| • Land | 1,117 sq mi (2,890 km2) |
| • Water | 5.9 sq mi (15 km2) 0.5% |
| Population (2020) | |
• Total | 788 |
• Estimate (2024) | 747 |
| • Density | 0.705/sq mi (0.272/km2) |
| Time zone | UTC−7 (Mountain) |
| • Summer (DST) | UTC−6 (MDT) |
| Congressional district | 3rd |
| Website | hinsdalecounty |

Hinsdale County is a county located in the U.S. state of Colorado. As of the 2020 census, the population was 788,[1] making it the second least-populous county in Colorado. With a population density of only 0.71 inhabitants per square mile (0.27/km2), it is also the least-densely populated county in Colorado. The county seat and only incorporated municipality in the county is Lake City.[2] The county is named for George A. Hinsdale,[3] a prominent pioneer and former Lieut. Governor of Colorado Territory.
Geography
According to the U.S. Census Bureau, the county has a total area of 1,123 square miles (2,910 km2), of which 1,117 square miles (2,890 km2) is land and 5.9 square miles (15 km2) (0.5%) is water.[4]
Hinsdale County is one of the most remote counties in Colorado and the United States. The county is covered by mountains, including multiple fourteeners, and contains one of the largest roadless areas in the country.[5][6] The continental divide crosses the county twice. Most of the county is divided among several different national forests and the Weminuche Wilderness area. The county is 96.5% public lands.[7]
Adjacent counties
- Gunnison – north
- Saguache – northeast
- Mineral – east
- Archuleta – southeast
- La Plata – southwest
- San Juan – west
- Ouray – northwest
Major highways
Demographics
| Census | Pop. | Note | %± |
|---|---|---|---|
| 1880 | 1,487 | — | |
| 1890 | 862 | −42.0% | |
| 1900 | 1,609 | 86.7% | |
| 1910 | 646 | −59.9% | |
| 1920 | 538 | −16.7% | |
| 1930 | 449 | −16.5% | |
| 1940 | 349 | −22.3% | |
| 1950 | 263 | −24.6% | |
| 1960 | 208 | −20.9% | |
| 1970 | 202 | −2.9% | |
| 1980 | 408 | 102.0% | |
| 1990 | 467 | 14.5% | |
| 2000 | 790 | 69.2% | |
| 2010 | 843 | 6.7% | |
| 2020 | 788 | −6.5% | |
| 2024 (est.) | 747 | [8] | −5.2% |
| U.S. Decennial Census[9] 1790-1960[10] 1900-1990[11] 1990-2000[12] 2010-2020[1] | |||
2020 census
As of the 2020 census, the county had a population of 788.[13] Of the residents, 16.6% were under the age of 18 and 32.0% were 65 years of age or older; the median age was 56.3 years. For every 100 females there were 106.8 males, and for every 100 females age 18 and over there were 106.0 males. 0.0% of residents lived in urban areas and 100.0% lived in rural areas.[14][15][13]
| Race / Ethnicity (NH = Non-Hispanic) | Pop 2000[16] | Pop 2010[17] | Pop 2020[18] | % 2000 | % 2010 | % 2020 |
|---|---|---|---|---|---|---|
| White alone (NH) | 763 | 786 | 693 | 96.58% | 93.24% | 87.94% |
| Black or African American alone (NH) | 0 | 3 | 8 | 0.00% | 0.36% | 1.02% |
| Native American or Alaska Native alone (NH) | 9 | 7 | 6 | 1.14% | 0.83% | 0.76% |
| Asian alone (NH) | 2 | 3 | 2 | 0.25% | 0.36% | 0.25% |
| Pacific Islander alone (NH) | 0 | 0 | 1 | 0.00% | 0.00% | 0.13% |
| Other race alone (NH) | 1 | 6 | 6 | 0.13% | 0.71% | 0.76% |
| Mixed race or Multiracial (NH) | 3 | 14 | 42 | 0.38% | 1.66% | 5.33% |
| Hispanic or Latino (any race) | 12 | 24 | 30 | 1.52% | 2.85% | 3.81% |
| Total | 790 | 843 | 788 | 100.00% | 100.00% | 100.00% |
The racial makeup of the county was 89.6% White, 1.0% Black or African American, 0.8% American Indian and Alaska Native, 0.4% Asian, 0.1% Native Hawaiian and Pacific Islander, 0.8% from some other race, and 7.4% from two or more races. Hispanic or Latino residents of any race comprised 3.8% of the population.[13]
There were 375 households in the county, of which 24.5% had children under the age of 18 living with them and 17.3% had a female householder with no spouse or partner present. About 26.7% of all households were made up of individuals and 10.4% had someone living alone who was 65 years of age or older.[15]
There were 1,329 housing units, of which 71.8% were vacant. Among occupied housing units, 76.0% were owner-occupied and 24.0% were renter-occupied. The homeowner vacancy rate was 2.3% and the rental vacancy rate was 10.3%.[15]
2000 census
As of the census of 2000, there were 790 people, 359 households, and 246 families living in the county. The population density was 0.7 people per square mile (0.27 people/km2). There were 1,304 housing units at an average density of 1.2 units per square mile (0.46 units/km2). The racial makeup of the county was 97.34% White, 1.52% Native American, 0.25% Asian, 0.38% from other races, and 0.51% from two or more races. 1.52% of the population were Hispanic or Latino of any race.
There were 359 households, out of which 23.4% had children under the age of 18 living with them, 61.0% were married couples living together, 4.7% had a female householder with no husband present, and 31.20% were non-families. 24.8% of all households were made up of individuals, and 3.1% had someone living alone who was 65 years of age or older. The average household size was 2.2 and the average family size was 2.6.
In the county, the population was spread out, with 19.5% under the age of 18, 4.7% from 18 to 24, 29.5% from 25 to 44, 34.7% from 45 to 64, and 11.6% who were 65 years of age or older. The median age was 44 years. For every 100 females there were 105.7 males. For every 100 females age 18 and over, there were 109.9 males.
The median income for a household in the county was $37,279, and the median income for a family was $42,159. Males had a median income of $26,210 versus $23,750 for females. The per capita income for the county was $22,360. About 4.5% of families and 7.2% of the population were below the poverty line, including none of those under age 18 and 2.2% of those age 65 or over.
Politics
Republican presidential nominees have carried Hinsdale County since Franklin Delano Roosevelt defeated Alf Landon by eight votes in 1936. Along with Elbert County and Washington County it was one of three Colorado counties to vote for Barry Goldwater over Lyndon Johnson in 1964. In 2020, Joe Biden received the highest vote share for a Democrat since Johnson, and became the third Democrat since 1940 to breach 40% of the vote.
The last Democrat to carry Hinsdale County in a statewide election was John Hickenlooper in the 2010 gubernatorial contest,[19] and the only other case since at least 1980 have been Democratic senator Ben “Nighthorse” Campbell, who was later to shift to the Republican Party, in 1992, alongside popular Governor Roy Romer, who carried all but three counties statewide, in 1990.[20]
| Year | Republican | Democratic | Third party(ies) | |||
|---|---|---|---|---|---|---|
| No. | % | No. | % | No. | % | |
| 1880 | 421 | 53.84% | 361 | 46.16% | 0 | 0.00% |
| 1884 | 245 | 57.11% | 180 | 41.96% | 4 | 0.93% |
| 1888 | 158 | 57.66% | 116 | 42.34% | 0 | 0.00% |
| 1892 | 412 | 25.81% | 0 | 0.00% | 1,184 | 74.19% |
| 1896 | 19 | 2.63% | 697 | 96.40% | 7 | 0.97% |
| 1900 | 230 | 27.68% | 595 | 71.60% | 6 | 0.72% |
| 1904 | 243 | 47.55% | 239 | 46.77% | 29 | 5.68% |
| 1908 | 156 | 38.71% | 215 | 53.35% | 32 | 7.94% |
| 1912 | 136 | 38.64% | 157 | 44.60% | 59 | 16.76% |
| 1916 | 94 | 31.13% | 178 | 58.94% | 30 | 9.93% |
| 1920 | 149 | 59.13% | 67 | 26.59% | 36 | 14.29% |
| 1924 | 138 | 50.00% | 79 | 28.62% | 59 | 21.38% |
| 1928 | 128 | 53.78% | 106 | 44.54% | 4 | 1.68% |
| 1932 | 94 | 38.21% | 138 | 56.10% | 14 | 5.69% |
| 1936 | 129 | 47.78% | 137 | 50.74% | 4 | 1.48% |
| 1940 | 150 | 58.82% | 103 | 40.39% | 2 | 0.78% |
| 1944 | 124 | 67.03% | 61 | 32.97% | 0 | 0.00% |
| 1948 | 133 | 63.94% | 75 | 36.06% | 0 | 0.00% |
| 1952 | 154 | 74.04% | 54 | 25.96% | 0 | 0.00% |
| 1956 | 155 | 76.73% | 47 | 23.27% | 0 | 0.00% |
| 1960 | 138 | 62.73% | 82 | 37.27% | 0 | 0.00% |
| 1964 | 107 | 53.23% | 94 | 46.77% | 0 | 0.00% |
| 1968 | 127 | 66.15% | 43 | 22.40% | 22 | 11.46% |
| 1972 | 172 | 77.48% | 44 | 19.82% | 6 | 2.70% |
| 1976 | 189 | 66.55% | 83 | 29.23% | 12 | 4.23% |
| 1980 | 232 | 69.05% | 76 | 22.62% | 28 | 8.33% |
| 1984 | 310 | 74.88% | 98 | 23.67% | 6 | 1.45% |
| 1988 | 295 | 72.48% | 111 | 27.27% | 1 | 0.25% |
| 1992 | 188 | 39.50% | 151 | 31.72% | 137 | 28.78% |
| 1996 | 289 | 52.83% | 185 | 33.82% | 73 | 13.35% |
| 2000 | 316 | 55.83% | 188 | 33.22% | 62 | 10.95% |
| 2004 | 355 | 58.97% | 236 | 39.20% | 11 | 1.83% |
| 2008 | 344 | 57.43% | 240 | 40.07% | 15 | 2.50% |
| 2012 | 353 | 58.83% | 229 | 38.17% | 18 | 3.00% |
| 2016 | 339 | 57.56% | 197 | 33.45% | 53 | 9.00% |
| 2020 | 353 | 55.85% | 255 | 40.35% | 24 | 3.80% |
| 2024 | 332 | 54.70% | 257 | 42.34% | 18 | 2.97% |
Recreation
National forests
- Gunnison National Forest
- Rio Grande National Forest
- San Juan National Forest
- Uncompahgre National Forest
National wilderness areas
Trails
- Colorado Trail
- Continental Divide National Scenic Trail
- West Lost Trail Creek National Recreation Trail
Scenic byways
Communities

Town
Census-designated places
Ghost towns
- Beartown
- Burrows Park
- Capitol City
- Carson
- Henson
- Old Carson
Education
School districts include:[23]
See also
- Bibliography of Colorado
- Geography of Colorado
- History of Colorado
- Index of Colorado-related articles
- List of Colorado-related lists
- Outline of Colorado
References
- ^ a b "State & County QuickFacts". United States Census Bureau. Retrieved September 5, 2021.
- ^ "Find a County". National Association of Counties. Archived from the original on May 31, 2011. Retrieved June 7, 2011.
- ^ Gannett, Henry (1905). The Origin of Certain Place Names in the United States. Govt. Print. Off. pp. 157.
- ^ "US Gazetteer files: 2010, 2000, and 1990". United States Census Bureau. February 12, 2011. Retrieved April 23, 2011.
- ^ Watts, Raymond D.; Compton, Roger W.; McCammon, John H.; Rich, Carl L.; Wright, Stewart M.; Owens, Tom; Ouren, Douglas S. (May 4, 2007). "Roadless Space of the Conterminous United States". Science. 316 (5825): 736–738. doi:10.1126/science.1138141. ISSN 0036-8075.
- ^ Tracy Staedter (May 3, 2007). "Roadless Space Uneven Across U.S." Discovery News. Archived from the original on May 6, 2007.
- ^ "hinsdalecounty.colorado.gov". Archived from the original on August 20, 2025. Retrieved December 9, 2025.
- ^ "County Population Totals and Components of Change: 2020-2024". United States Census Bureau. Retrieved June 3, 2025.
- ^ "U.S. Decennial Census". United States Census Bureau. Archived from the original on April 26, 2015. Retrieved June 8, 2014.
- ^ "Historical Census Browser". University of Virginia Library. Retrieved June 8, 2014.
- ^ "Population of Counties by Decennial Census: 1900 to 1990". United States Census Bureau. Retrieved June 8, 2014.
- ^ "Census 2000 PHC-T-4. Ranking Tables for Counties: 1990 and 2000" (PDF). United States Census Bureau. Archived (PDF) from the original on March 27, 2010. Retrieved June 8, 2014.
- ^ a b c "2020 Decennial Census Redistricting Data (Public Law 94-171)". United States Census Bureau. 2021. Retrieved 2025-12-08.
- ^ "2020 Decennial Census Demographic and Housing Characteristics (DHC)". United States Census Bureau. 2023. Retrieved 2025-12-08.
- ^ a b c "2020 Decennial Census Demographic Profile (DP1)". United States Census Bureau. 2021. Retrieved 2025-12-08.
- ^ "P004: Hispanic or Latino, and Not Hispanic or Latino by Race – 2000: DEC Summary File 1 – Hinsdale County, Colorado". United States Census Bureau. Retrieved February 7, 2026.
- ^ "P2 Hispanic or Latino, and Not Hispanic or Latino by Race – 2010: DEC Redistricting Data (PL 94-171) - Hinsdale County, Colorado". United States Census Bureau. Retrieved February 7, 2026.
- ^ "P2 Hispanic or Latino, and Not Hispanic or Latino by Race – 2020: DEC Redistricting Data (PL 94-171) - Hinsdale County, Colorado". United States Census Bureau. Retrieved February 7, 2026.
- ^ Dave Leip’s U.S. Election Atlas; 2010 Gubernatorial General Election Results – Colorado
- ^ Dave Leip’s U.S. Election Atlas; 1990 Gubernatorial General Election Results – Colorado
- ^ Leip, David. "Dave Leip's Atlas of U.S. Presidential Elections". uselectionatlas.org. Retrieved May 26, 2017.
- ^ "Ghost Towns of Colorado- Hinsdale County". Ghost Towns. Retrieved June 21, 2020.
- ^ "2020 CENSUS - SCHOOL DISTRICT REFERENCE MAP: Hinsdale County, CO" (PDF). U.S. Census Bureau. Archived (PDF) from the original on July 13, 2022. Retrieved July 15, 2022. - Text list
External links
- State of Colorado
- Official website
- Official Tourism website for Lake City Hinsdale County Marketing Committee and Chamber of Commerce
- Lake City Downtown Improvement and Revitalization Team (Official Main Street Program)
- Colorado County Evolution by Don Stanwyck
Municipalities and communities of Hinsdale County, Colorado, United States | ||
|---|---|---|
| Town | 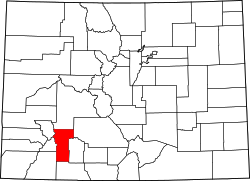 | |
| CDPs | ||
| Ghost town | ||
Places adjacent to Hinsdale County, Colorado | ||||||||||||||||
|---|---|---|---|---|---|---|---|---|---|---|---|---|---|---|---|---|
| ||||||||||||||||
| International | |
|---|---|
| National | |
| Other | |