


Union (CDP), New Jersey
Union, New Jersey | |
|---|---|
 Union CDP Location in Union County  Union CDP Location in New Jersey  Union CDP Location in the United States | |
| Coordinates: 40°41′47″N 74°16′11″W / 40.69639°N 74.26972°W | |
| Country | |
| State | |
| County | Union |
| Township | Union |
| Area | |
• Total | 0.25 sq mi (0.66 km2) |
| • Land | 0.25 sq mi (0.66 km2) |
| • Water | 0 sq mi (0.00 km2) |
| Elevation | 123 ft (37 m) |
| Population | |
• Total | 2,229 |
| • Density | 8,740/sq mi (3,374.4/km2) |
| Time zone | UTC−05:00 (Eastern (EST)) |
| • Summer (DST) | UTC−04:00 (EDT) |
| ZIP Code | 07083 |
| Area code | 908 |
| FIPS code | 34-74478[3] |
| GNIS feature ID | 2390415[4] |
Union is a census-designated place (CDP)[5] comprising the downtown area of Union Township, Union County, in the U.S. state of New Jersey. It was first listed as a CDP prior to the 2010 census.[4] The area is also known as Union Center.[6]
The CDP is bordered by Caldwell Avenue and Falls Terrace to the northwest, by Vauxhall Avenue and Haines Avenue to the northeast, by Warren Avenue to the east, by the Garden State Parkway to the southeast, by Burke Parkway to the southwest, and by Bond Drie, Rosemont Avenue, Stuyvesant Avenue, and Elmwood Avenue to the south.[7] Connecticut Farms borders the neighborhood to the south.
New Jersey Route 82 (Morris Avenue) is the main street through Union, leading southeast 4 miles (6 km) to Elizabeth and northwest 2 miles (3 km) to Springfield.
Demographics
| Census | Pop. | Note | %± |
|---|---|---|---|
| 2020 | 2,229 | — | |
| U.S. Decennial Census[8][2] | |||
Union first appeared as a census designated place in the 2020 U.S. census.[9]
2020 census
| Race / Ethnicity (NH = Non-Hispanic) | Pop 2020[10] | % 2020 |
|---|---|---|
| White alone (NH) | 660 | 29.61% |
| Black or African American alone (NH) | 565 | 25.35% |
| Native American or Alaska Native alone (NH) | 5 | 0.22% |
| Asian alone (NH) | 326 | 14.63% |
| Native Hawaiian or Pacific Islander alone (NH) | 0 | 0.00% |
| Other Race alone (NH) | 55 | 2.47% |
| Mixed race or Multiracial (NH) | 93 | 4.17% |
| Hispanic or Latino (any race) | 525 | 23.55% |
| Total | 2,229 | 100.00% |
References
- ^ "ArcGIS REST Services Directory". United States Census Bureau. Retrieved October 11, 2022.
- ^ a b "Census Population API". United States Census Bureau. Retrieved October 11, 2022.
- ^ Geographic Codes Lookup for New Jersey, Missouri Census Data Center. Accessed June 9, 2023.
- ^ a b "Union Census Designated Place". Geographic Names Information System. United States Geological Survey, United States Department of the Interior.
- ^ State of New Jersey Census Designated Places - BVP20 - Data as of January 1, 2020, United States Census Bureau. Accessed December 1, 2022.
- ^ "Union Center Business District". Union Township. Retrieved June 23, 2021.
- ^ "Union CDP". TIGERweb. Geography Division, U.S. Census Bureau. Retrieved June 23, 2021.
- ^ "Census of Population and Housing". Census.gov. Retrieved June 4, 2016.
- ^ "2020 Geography Changes". United States Census Bureau.
- ^ "P2 Hispanic or Latino, and Not Hispanic or Latino by Race – 2020: DEC Redistricting Data (PL 94-171) – Union CDP, New Jersey". United States Census Bureau.
Municipalities and communities of Union County, New Jersey, United States | ||
|---|---|---|
| Cities | 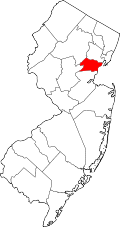 | |
| Boroughs | ||
| Town | ||
| Townships | ||
| CDPs | ||
| Other communities | ||