


Shelby, Alabama
Shelby, Alabama | |
|---|---|
 Location of Shelby in Shelby County, Alabama. | |
| Coordinates: 33°06′57″N 86°35′15″W / 33.11583°N 86.58750°W[1] | |
| Country | United States |
| State | Alabama |
| County | Shelby |
| Area | |
• Total | 19.01 sq mi (49.24 km2) |
| • Land | 18.76 sq mi (48.59 km2) |
| • Water | 0.25 sq mi (0.66 km2) |
| Elevation | 489 ft (149 m) |
| Population (2020) | |
• Total | 940 |
| • Density | 50.1/sq mi (19.35/km2) |
| Time zone | UTC-6 (Central (CST)) |
| • Summer (DST) | UTC-5 (CDT) |
| Postal code | 35143 |
| Area codes | 205, 659 |
| GNIS feature ID | 2582698[1] |
Shelby is a census-designated place and unincorporated community in Shelby County, Alabama, United States. Its population was 1,044 as of the 2010 census. The area is near Lay Lake and Waxahatchee Creek. Shelby Iron Park is located at the heart of the area.[3] Two sites in Shelby, The Brick House and the Old Shelby Hotel, are listed on the Alabama Register of Landmarks and Heritage.[4]
History
Shelby was home to the Shelby Iron Company. During the American Civil War, iron plating from the iron works was used on the CSS Tennessee, CSS Huntsville, and CSS Tuscaloosa. At this time, Shelby was connected to Columbiana by the Shelby Iron Company Railroad, which allowed the iron works to be connected to the Alabama and Tennessee River Railroad. A detachment of General Emory Upton's division of Wilson's Raiders destroyed the ironworks on March 31, 1865.[5]
Demographics
| Census | Pop. | Note | %± |
|---|---|---|---|
| 1880 | 567 | — | |
| 1890 | 753 | 32.8% | |
| 2010 | 1,044 | — | |
| 2020 | 940 | −10.0% | |
| U.S. Decennial Census[6] | |||
Shelby Iron Works was listed on the 1880 U.S. Census and was shortened to Shelby in 1890 as an incorporated town. It did not appear again as a separately returned community until 120 years later in 2010 when it was listed as a census designated place in the 2010 U.S. census.[7]
| Race / Ethnicity (NH = Non-Hispanic) | Pop 2010[8] | Pop 2020[9] | % 2010 | % 2020 |
|---|---|---|---|---|
| White alone (NH) | 934 | 800 | 89.46% | 85.11% |
| Black or African American alone (NH) | 70 | 63 | 6.70% | 6.70% |
| Native American or Alaska Native alone (NH) | 1 | 0 | 0.10% | 0.00% |
| Asian alone (NH) | 2 | 3 | 0.19% | 0.32% |
| Native Hawaiian or Pacific Islander alone (NH) | 0 | 0 | 0.00% | 0.00% |
| Other race alone (NH) | 0 | 1 | 0.00% | 0.11% |
| Mixed race or Multiracial (NH) | 13 | 33 | 1.25% | 3.51% |
| Hispanic or Latino (any race) | 24 | 40 | 2.30% | 4.26% |
| Total | 1,044 | 940 | 100.00% | 100.00% |
References
- ^ a b c U.S. Geological Survey Geographic Names Information System: Shelby, Alabama
- ^ "2020 U.S. Gazetteer Files". United States Census Bureau. Retrieved October 29, 2021.
- ^ "U.S. Census website". United States Census Bureau. Retrieved May 14, 2011.
- ^ "Properties on the Alabama Register of Landmarks & Heritage". Alabama Historical Commission. www.preserveala.org. Archived from the original on September 4, 2012. Retrieved June 5, 2014.
- ^ "Shelby Iron Company". Rootsweb.ancestry.com. Retrieved June 5, 2014.
- ^ "U.S. Decennial Census". Census.gov. Retrieved June 6, 2013.
- ^ "2010 Census of Population - Population and Housing Unit Counts - Alabama" (PDF). United States Census Bureau. 2010. Archived from the original (PDF) on January 21, 2022.
- ^ "P2: Hispanic or Latino, and Not Hispanic or Latino by Race – 2010: DEC Redistricting Data (PL 94-171) – Shelby CDP, Alabama". United States Census Bureau.
- ^ "P2: Hispanic or Latino, and Not Hispanic or Latino by Race – 2020: DEC Redistricting Data (PL 94-171) – Shelby CDP, Alabama". United States Census Bureau.
Municipalities and communities of Shelby County, Alabama, United States | ||
|---|---|---|
| Cities | 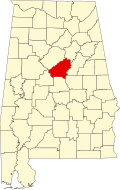 | |
| Towns | ||
| CDPs | ||
| Other unincorporated communities | ||
| Footnotes | ‡This populated place also has portions in an adjacent county or counties | |