


Crisp County, Georgia
Crisp County, Georgia | |
|---|---|
.JPG) Crisp County Courthouse in Cordele | |
 Location within the U.S. state of Georgia | |
| Coordinates: 31°56′N 83°46′W / 31.93°N 83.77°W | |
| Country | |
| State | |
| Founded | 1905 |
| Named after | Charles Frederick Crisp |
| Seat | Cordele |
| Largest city | Cordele |
| Area | |
• Total | 281 sq mi (730 km2) |
| • Land | 273 sq mi (710 km2) |
| • Water | 8.4 sq mi (22 km2) 3.0% |
| Population (2020) | |
• Total | 20,128 |
| • Density | 74/sq mi (29/km2) |
| Time zone | UTC−5 (Eastern) |
| • Summer (DST) | UTC−4 (EDT) |
| Congressional district | 2nd |
| Website | www |
Crisp County is a county located in the central portion of the U.S. state of Georgia. As of the 2020 census, the population was 20,128.[1] The county seat is Cordele.[2] The county was created on August 17, 1905, from Dooly County and named for Georgia Congressman Charles Frederick Crisp.[3][4]
Crisp County comprises the Cordele, GA micropolitan statistical area.
Geography
According to the U.S. Census Bureau, the county has a total area of 281 square miles (730 km2), of which 273 square miles (710 km2) is land and 8.4 square miles (22 km2) (3.0%) is water.[5]
The western two-thirds of Crisp County, bordered on the east by a line from south of Arabi running northeast, is located in the Middle Flint River sub-basin of the ACF River Basin (Apalachicola-Chattahoochee-Flint River Basin). The eastern third of the county is located in the Alapaha River sub-basin of the Suwannee River.[6]
Major highways
Adjacent counties
- Dooly County (north)
- Wilcox County (east)
- Turner County (southeast)
- Worth County (southwest)
- Lee County (west)
- Sumter County (west)
Communities
City
- Cordele (county seat)
Town
Census-designated place
Unincorporated territory
Demographics
| Census | Pop. | Note | %± |
|---|---|---|---|
| 1910 | 16,423 | — | |
| 1920 | 18,914 | 15.2% | |
| 1930 | 17,343 | −8.3% | |
| 1940 | 17,540 | 1.1% | |
| 1950 | 17,663 | 0.7% | |
| 1960 | 17,768 | 0.6% | |
| 1970 | 18,087 | 1.8% | |
| 1980 | 19,489 | 7.8% | |
| 1990 | 20,011 | 2.7% | |
| 2000 | 21,996 | 9.9% | |
| 2010 | 23,439 | 6.6% | |
| 2020 | 20,128 | −14.1% | |
| 2024 (est.) | 19,468 | [7] | −3.3% |
| U.S. Decennial Census[8] 1790-1880[9] 1890-1910[10] 1920-1930[11] 1930-1940[12] 1940-1950[13] 1960-1980[14] 1980-2000[15] 2010[16] | |||
| Race | Num. | Perc. |
|---|---|---|
| White (non-Hispanic) | 9,892 | 49.15% |
| Black or African American (non-Hispanic) | 8,821 | 43.82% |
| Native American | 18 | 0.09% |
| Asian | 180 | 0.89% |
| Pacific Islander | 4 | 0.02% |
| Other/Mixed | 579 | 2.88% |
| Hispanic or Latino | 634 | 3.15% |
2020 census
As of the 2020 census, the county had a population of 20,128, 8,346 households, and 5,712 families. The median age was 41.9 years. 22.6% of residents were under the age of 18 and 19.8% of residents were 65 years of age or older. For every 100 females there were 89.7 males, and for every 100 females age 18 and over there were 86.6 males age 18 and over. 54.3% of residents lived in urban areas, while 45.7% lived in rural areas.[18][19][20]
The racial makeup of the county was 49.7% White, 44.1% Black or African American, 0.2% American Indian and Alaska Native, 0.9% Asian, 0.0% Native Hawaiian and Pacific Islander, 1.9% from some other race, and 3.2% from two or more races. Hispanic or Latino residents of any race comprised 3.1% of the population.[20]
Of the households, 28.9% had children under the age of 18 living with them and 37.8% had a female householder with no spouse or partner present. About 32.4% of all households were made up of individuals and 14.1% had someone living alone who was 65 years of age or older.[19]
There were 9,854 housing units, of which 15.3% were vacant. Among occupied housing units, 55.8% were owner-occupied and 44.2% were renter-occupied. The homeowner vacancy rate was 2.0% and the rental vacancy rate was 6.0%.[19]
Education
Politics
As of the 2020s, Crisp County is a strongly Republican voting county, voting 62.83% for Donald Trump in 2024. For elections to the United States House of Representatives, Crisp County is part of Georgia's 8th congressional district, currently represented by Austin Scott. For elections to the Georgia State Senate, Crisp County is part of District 13.[21] For elections to the Georgia House of Representatives, Crisp County is part of District 148.[22]
| Year | Republican | Democratic | Third party(ies) | |||
|---|---|---|---|---|---|---|
| No. | % | No. | % | No. | % | |
| 1912 | 45 | 6.42% | 644 | 91.87% | 12 | 1.71% |
| 1916 | 100 | 14.68% | 577 | 84.73% | 4 | 0.59% |
| 1920 | 83 | 12.81% | 565 | 87.19% | 0 | 0.00% |
| 1924 | 21 | 4.41% | 439 | 92.23% | 16 | 3.36% |
| 1928 | 402 | 43.46% | 523 | 56.54% | 0 | 0.00% |
| 1932 | 10 | 1.35% | 725 | 97.97% | 5 | 0.68% |
| 1936 | 79 | 7.12% | 1,029 | 92.70% | 2 | 0.18% |
| 1940 | 129 | 10.91% | 1,049 | 88.75% | 4 | 0.34% |
| 1944 | 217 | 15.32% | 1,199 | 84.68% | 0 | 0.00% |
| 1948 | 221 | 11.22% | 1,225 | 62.18% | 524 | 26.60% |
| 1952 | 949 | 30.96% | 2,116 | 69.04% | 0 | 0.00% |
| 1956 | 835 | 24.84% | 2,526 | 75.16% | 0 | 0.00% |
| 1960 | 963 | 28.94% | 2,365 | 71.06% | 0 | 0.00% |
| 1964 | 3,337 | 65.52% | 1,756 | 34.48% | 0 | 0.00% |
| 1968 | 935 | 17.90% | 1,017 | 19.47% | 3,271 | 62.63% |
| 1972 | 3,623 | 84.16% | 682 | 15.84% | 0 | 0.00% |
| 1976 | 1,328 | 26.17% | 3,747 | 73.83% | 0 | 0.00% |
| 1980 | 1,861 | 34.80% | 3,403 | 63.64% | 83 | 1.55% |
| 1984 | 2,895 | 57.63% | 2,128 | 42.37% | 0 | 0.00% |
| 1988 | 2,916 | 62.94% | 1,690 | 36.48% | 27 | 0.58% |
| 1992 | 2,253 | 39.46% | 2,610 | 45.72% | 846 | 14.82% |
| 1996 | 2,321 | 43.83% | 2,504 | 47.28% | 471 | 8.89% |
| 2000 | 3,285 | 58.57% | 2,268 | 40.44% | 56 | 1.00% |
| 2004 | 3,865 | 61.80% | 2,357 | 37.69% | 32 | 0.51% |
| 2008 | 4,424 | 58.56% | 3,085 | 40.84% | 45 | 0.60% |
| 2012 | 4,182 | 56.51% | 3,167 | 42.80% | 51 | 0.69% |
| 2016 | 4,549 | 60.26% | 2,837 | 37.58% | 163 | 2.16% |
| 2020 | 4,985 | 62.03% | 2,982 | 37.11% | 69 | 0.86% |
| 2024 | 5,099 | 62.83% | 2,993 | 36.88% | 24 | 0.30% |
| Year | Republican | Democratic | Third party(ies) | |||
|---|---|---|---|---|---|---|
| No. | % | No. | % | No. | % | |
| 2020 | 5,054 | 63.33% | 2,809 | 35.20% | 117 | 1.47% |
| 2020 | 4,454 | 62.42% | 2,681 | 37.58% | 0 | 0.00% |
| Year | Republican | Democratic | Third party(ies) | |||
|---|---|---|---|---|---|---|
| No. | % | No. | % | No. | % | |
| 2020 | 2,330 | 29.55% | 1,738 | 22.04% | 3,817 | 48.41% |
| 2020 | 4,436 | 62.15% | 2,702 | 37.85% | 0 | 0.00% |
| 2022 | 4,058 | 64.35% | 2,164 | 34.32% | 84 | 1.33% |
| 2022 | 3,732 | 64.71% | 2,035 | 35.29% | 0 | 0.00% |
| Year | Republican | Democratic | Third party(ies) | |||
|---|---|---|---|---|---|---|
| No. | % | No. | % | No. | % | |
| 2022 | 4,296 | 67.95% | 2,013 | 31.84% | 13 | 0.21% |
See also
References
- ^ "Census - Geography Profile: Crisp County, Georgia". United States Census Bureau. Retrieved December 26, 2022.
- ^ "Find a County". National Association of Counties. Archived from the original on May 31, 2011. Retrieved June 7, 2011.
- ^ "Crisp County, Georgia | Government For The People". www.crispcounty.com. Retrieved March 19, 2018.
- ^ Krakow, Kenneth K. (1975). Georgia Place-Names: Their History and Origins (PDF). Macon, GA: Winship Press. p. 54. ISBN 0-915430-00-2. Archived (PDF) from the original on July 10, 2003.
- ^ "US Gazetteer files: 2010, 2000, and 1990". United States Census Bureau. February 12, 2011. Retrieved April 23, 2011.
- ^ "Georgia Soil and Water Conservation Commission Interactive Mapping Experience". Georgia Soil and Water Conservation Commission. Archived from the original on October 3, 2018. Retrieved November 24, 2015.
- ^ "County Population Totals and Components of Change: 2020-2024". United States Census Bureau. Retrieved August 22, 2025.
- ^ "Decennial Census of Population and Housing by Decades". US Census Bureau.
- ^ "1880 Census Population by Counties 1790-1800" (PDF). US Census Bureau. 1880.
- ^ "1910 Census of Population - Georgia" (PDF). US Census Bureau. 1910.
- ^ "1930 Census of Population - Georgia" (PDF). US Census Bureau. 1930.
- ^ "1940 Census of Population - Georgia" (PDF). US Census Bureau. 1940.
- ^ "1950 Census of Population - Georgia -" (PDF). US Census Bureau. 1950.
- ^ "1980 Census of Population - Number of Inhabitants - Georgia" (PDF). US Census Bureau. 1980.
- ^ "2000 Census of Population - Population and Housing Unit Counts - Georgia" (PDF). US Census Bureau. 2000.
- ^ "State & County QuickFacts". United States Census Bureau. Archived from the original on February 21, 2016. Retrieved February 15, 2014.
- ^ "Explore Census Data". data.census.gov. Retrieved December 15, 2021.
- ^ "2020 Decennial Census Demographic and Housing Characteristics (DHC)". United States Census Bureau. 2023. Retrieved 12 December 2025.
- ^ a b c "2020 Decennial Census Demographic Profile (DP1)". United States Census Bureau. 2021. Retrieved 12 December 2025.
- ^ a b "2020 Decennial Census Redistricting Data (Public Law 94-171)". United States Census Bureau. 2021. Retrieved 12 December 2025.
- ^ "Georgia General Assembly". www.legis.ga.gov. Retrieved November 28, 2025.
- ^ "Georgia General Assembly". www.legis.ga.gov. Retrieved November 28, 2025.
- ^ Leip, David. "Dave Leip's Atlas of U.S. Presidential Elections". uselectionatlas.org. Retrieved March 19, 2018.
External links
- http://www.crispcounty.com
- Crisp County historical marker
Places adjacent to Crisp County, Georgia | ||||||||||||||||
|---|---|---|---|---|---|---|---|---|---|---|---|---|---|---|---|---|
| ||||||||||||||||
Municipalities and communities of Crisp County, Georgia, United States | ||
|---|---|---|
| City | 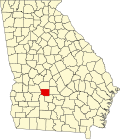 | |
| Town | ||
| CDP | ||
| Other unincorporated communities | ||
| International | |
|---|---|
| National | |
| Other | |