


Monongalia County, West Virginia
Monongalia County, West Virginia | |
|---|---|
 | |
 Flag  Seal | |
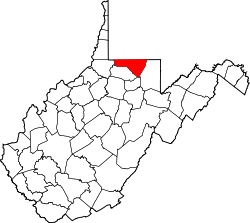
 Location within the U.S. state of West Virginia | |
| Coordinates: 39°38′N 80°03′W / 39.63°N 80.05°W | |
| Country | |
| State | |
| Founded | October 9, 1776 |
| Named after | Latin name for the Monongahela River |
| Seat | Morgantown |
| Largest city | Morgantown |
| Area | |
• Total | 366 sq mi (950 km2) |
| • Land | 360 sq mi (930 km2) |
| • Water | 5.8 sq mi (15 km2) 1.6% |
| Population (2020) | |
• Total | 105,822 |
• Estimate (2024) | 108,697 |
| • Density | 296/sq mi (114/km2) |
| Time zone | UTC−5 (Eastern) |
| • Summer (DST) | UTC−4 (EDT) |
| Congressional district | 2nd |
| Website | www |

Monongalia County, known locally as Mon County, is a county located in the U.S. state of West Virginia. As of the 2020 census, the population was 105,822,[1] making it West Virginia's third-most populous county. Its county seat is Morgantown.[2] The county was founded in 1776.[3] Monongalia County is included in the Morgantown, WV Metropolitan Statistical Area, and is the largest county in North-Central West Virginia. It is part of the Pittsburgh media market.
History

Monongalia County takes its name from the Monongahela River. The name Monongalia may be a misspelling of Monongahela. Alternatively, the conventional Latinate ending "-ia" (designating "land of..." or "country of..." — as in Arabia, Bolivia or Colombia) may have been added to Monongahela (i.e., "Land of the Monongahela").
Monongalia County was formed in 1776 when Virginia's remote District of West Augusta was divided into three counties: Ohio, Yohogania and Monongalia, all named for their most prominent rivers. Ohio County then encompassed most of the western region of the district bordering the Ohio River, including parts of what is now southwestern Pennsylvania. Yohogania County consisted of much of what is now southwestern Pennsylvania and the present counties of Hancock and the northern part of Brooke in West Virginia. Monongalia County also encompassed what are now the counties of Tucker, Randolph, Marion, Harrison and Barbour in north-central West Virginia, as well as parts of what are now Washington, Greene and Fayette Counties in Pennsylvania. In 1780, in his Notes on the State of Virginia, Thomas Jefferson gave the militia enrollment of what was then the vast Monongalia County at 1,000 troops.

In 1863, West Virginia's counties were divided into civil townships, with the intention of encouraging local government. This proved impractical in the heavily rural state, and in 1872 the townships were converted into magisterial districts.[4] Monongalia County was divided into seven districts: Battelle, Cass, Clay, Clinton, Grant, Morgan, and Union. After a century of relative stability, in the 1970s Monongalia's seven historic magisterial districts were consolidated into three new Districts: Central, Eastern, and Western.[5]
Geography
Adjacent counties
- Fayette County, Pennsylvania (northeast)
- Greene County, Pennsylvania (north)
- Marion County (south)
- Preston County (east)
- Taylor County (southeast)
- Wetzel County (west)
Major highways
Rivers, streams, and lakes
- Aarons Creek
- Cam Harker Spring
- Cheat Lake
- Cheat River
- Deckers Creek
- Dunkard Creek
- Jakes Run
- Monongahela River
Ridges
Demographics
| Census | Pop. | Note | %± |
|---|---|---|---|
| 1790 | 4,768 | — | |
| 1800 | 8,540 | 79.1% | |
| 1810 | 12,793 | 49.8% | |
| 1820 | 11,060 | −13.5% | |
| 1830 | 14,056 | 27.1% | |
| 1840 | 17,368 | 23.6% | |
| 1850 | 12,387 | −28.7% | |
| 1860 | 13,048 | 5.3% | |
| 1870 | 13,547 | 3.8% | |
| 1880 | 14,985 | 10.6% | |
| 1890 | 15,705 | 4.8% | |
| 1900 | 19,049 | 21.3% | |
| 1910 | 24,334 | 27.7% | |
| 1920 | 33,618 | 38.2% | |
| 1930 | 50,083 | 49.0% | |
| 1940 | 51,252 | 2.3% | |
| 1950 | 60,797 | 18.6% | |
| 1960 | 55,617 | −8.5% | |
| 1970 | 63,714 | 14.6% | |
| 1980 | 75,024 | 17.8% | |
| 1990 | 75,509 | 0.6% | |
| 2000 | 81,866 | 8.4% | |
| 2010 | 96,189 | 17.5% | |
| 2020 | 105,822 | 10.0% | |
| 2023 (est.) | 107,718 | [6] | 1.8% |
| U.S. Decennial Census[7] 1790–1960[8] 1900–1990[9] 1990–2000[10] 2010–2020[1] | |||
2020 census
As of the 2020 census, the county had a population of 105,822. Of the residents, 16.8% were under the age of 18 and 13.0% were 65 years of age or older; the median age was 31.1 years. For every 100 females there were 100.7 males, and for every 100 females age 18 and over there were 99.6 males.[11][12]
The racial makeup of the county was 85.1% White, 3.9% Black or African American, 0.2% American Indian and Alaska Native, 3.5% Asian, 1.1% from some other race, and 6.1% from two or more races. Hispanic or Latino residents of any race comprised 3.1% of the population.[12]
There were 44,385 households in the county, of which 22.8% had children under the age of 18 living with them and 28.4% had a female householder with no spouse or partner present. About 34.8% of all households were made up of individuals and 8.7% had someone living alone who was 65 years of age or older.[11]
There were 49,881 housing units, of which 11.0% were vacant. Among occupied housing units, 54.5% were owner-occupied and 45.5% were renter-occupied. The homeowner vacancy rate was 1.9% and the rental vacancy rate was 10.2%.[11]
The average household and family size was 3.06.[13] The median income for a household in the county was $56,374.[13]
| Race / Ethnicity (NH = Non-Hispanic) | Pop 2000[14] | Pop 2010[15] | Pop 2020[16] | % 2000 | % 2010 | % 2020 |
|---|---|---|---|---|---|---|
| White alone (NH) | 74,965 | 86,298 | 88,959 | 91.57% | 89.72% | 84.07% |
| Black or African American alone (NH) | 2,740 | 3,436 | 4,068 | 3.35% | 3.57% | 3.84% |
| Native American or Alaska Native alone (NH) | 150 | 132 | 147 | 0.18% | 0.14% | 0.14% |
| Asian alone (NH) | 1,998 | 2,929 | 3,729 | 2.44% | 3.04% | 3.52% |
| Pacific Islander alone (NH) | 25 | 42 | 63 | 0.03% | 0.04% | 0.06% |
| Other race alone (NH) | 86 | 93 | 382 | 0.11% | 0.10% | 0.36% |
| Mixed race or Multiracial (NH) | 1,076 | 1,567 | 5,166 | 1.31% | 1.63% | 4.88% |
| Hispanic or Latino (any race) | 826 | 1,692 | 3,308 | 1.01% | 1.76% | 3.13% |
| Total | 81,866 | 96,189 | 105,822 | 100.00% | 100.00% | 100.00% |
2010 census
As of the 2010 United States census, there were 96,189 people, 39,777 households, and 20,032 families living in the county.[17] The population density was 267.1 inhabitants per square mile (103.1/km2). There were 43,238 housing units at an average density of 120.1 per square mile (46.4/km2).[18] The racial makeup of the county was 91.0% white, 3.6% black or African American, 3.1% Asian, 0.2% American Indian, 0.4% from other races, and 1.8% from two or more races. Those of Hispanic or Latino origin made up 1.8% of the population.[17] In terms of ancestry, 25.7% were German, 17.1% were Irish, 13.0% were English, 11.0% were Italian, 7.5% were American, and 5.0% were Polish.[19]
Of the 39,777 households, 22.0% had children under the age of 18 living with them, 38.3% were married couples living together, 8.2% had a female householder with no husband present, 49.6% were non-families, and 31.7% of all households were made up of individuals. The average household size was 2.24 and the average family size was 2.87. The median age was 29.1 years.[17]
The median income for a household in the county was $39,167 and the median income for a family was $62,966. Males had a median income of $43,383 versus $32,164 for females. The per capita income for the county was $23,116. About 8.6% of families and 21.0% of the population were below the poverty line, including 13.2% of those under age 18 and 7.6% of those age 65 or over.[20]
2000 census
As of the census[21] of 2000, there were 81,866 people, 33,446 households, and 18,495 families living in the county. The population density was 227 people per square mile (88 people/km2). There were 36,695 housing units at an average density of 102 per square mile (39/km2). The racial makeup of the county was 92.22% White, 3.38% Black or African American, 0.20% Native American, 2.45% Asian, 0.04% Pacific Islander, 0.32% from other races, and 1.39% from two or more races. 1.01% of the population were Hispanic or Latino of any race.
There were 33,446 households, out of which 24.20% had children under the age of 18 living with them, 43.80% were married couples living together, 8.30% had a female householder with no husband present, and 44.70% were non-families. 31.30% of all households were made up of individuals, and 8.40% had someone living alone who was 65 years of age or older. The average household size was 2.28 and the average family size was 2.91.
In the county, the population was spread out, with 18.20% under the age of 18, 23.40% from 18 to 24, 27.70% from 25 to 44, 20.00% from 45 to 64, and 10.70% who were 65 years of age or older. The median age was 30 years. For every 100 females, there were 101.80 males. For every 100 females age 18 and over, there were 101.20 males.
The median income for a household in the county was $28,625, and the median income for a family was $43,628. Males had a median income of $33,113 versus $23,828 for females. The per capita income for the county was $17,106. About 11.30% of families and 22.80% of the population were below the poverty line, including 17.90% of those under age 18 and 8.00% of those age 65 or over.
Government and politics
The county government consists of a county commission with three members. Currently, these members are: Thomas Bloom (D),[22] Sean Sikora (R) and Jeffery Arnett (D).[23] While still typically favoring Republicans, the county tends to lean significantly more Democratic than the rest of West Virginia.
In the 20th century, Monongalia County had been a bellwether for West Virginia, voting the same as the state in every election from 1916 to 2024, even as the candidate lost the national election, with the sole exception of 2008 when Barack Obama won the county and lost the state. Donald Trump carried the county with just over 500 more votes than Democrat Joe Biden in the 2020 presidential election, by far Biden's best county-level performance in the state.
Its competitiveness is due to its seat, Morgantown, home of the West Virginia University, being solidly Democratic and the county's rural precincts being solidly Republican. The rural precincts are slightly more populous, resulting in the county's Republican tilt.
| Year | Republican | Democratic | Third party(ies) | |||
|---|---|---|---|---|---|---|
| No. | % | No. | % | No. | % | |
| 1912 | 1,216 | 23.20% | 1,673 | 31.92% | 2,352 | 44.88% |
| 1916 | 3,412 | 57.48% | 2,227 | 37.52% | 297 | 5.00% |
| 1920 | 6,773 | 63.99% | 3,442 | 32.52% | 369 | 3.49% |
| 1924 | 6,994 | 49.57% | 4,977 | 35.27% | 2,139 | 15.16% |
| 1928 | 11,364 | 64.08% | 6,182 | 34.86% | 188 | 1.06% |
| 1932 | 8,417 | 43.79% | 10,319 | 53.69% | 485 | 2.52% |
| 1936 | 8,811 | 39.02% | 13,677 | 60.57% | 94 | 0.42% |
| 1940 | 10,367 | 44.48% | 12,940 | 55.52% | 0 | 0.00% |
| 1944 | 9,647 | 48.05% | 10,429 | 51.95% | 0 | 0.00% |
| 1948 | 9,329 | 43.02% | 12,138 | 55.98% | 216 | 1.00% |
| 1952 | 13,111 | 49.92% | 13,152 | 50.08% | 0 | 0.00% |
| 1956 | 14,046 | 56.05% | 11,016 | 43.95% | 0 | 0.00% |
| 1960 | 11,523 | 46.79% | 13,103 | 53.21% | 0 | 0.00% |
| 1964 | 6,473 | 27.16% | 17,358 | 72.84% | 0 | 0.00% |
| 1968 | 9,261 | 38.68% | 13,128 | 54.83% | 1,556 | 6.50% |
| 1972 | 16,758 | 60.98% | 10,721 | 39.02% | 0 | 0.00% |
| 1976 | 11,827 | 42.25% | 16,163 | 57.75% | 0 | 0.00% |
| 1980 | 11,972 | 43.02% | 12,883 | 46.30% | 2,971 | 10.68% |
| 1984 | 14,972 | 52.95% | 13,236 | 46.81% | 66 | 0.23% |
| 1988 | 12,091 | 45.91% | 14,178 | 53.83% | 69 | 0.26% |
| 1992 | 9,831 | 34.35% | 14,142 | 49.41% | 4,650 | 16.25% |
| 1996 | 10,189 | 37.99% | 13,406 | 49.99% | 3,225 | 12.02% |
| 2000 | 13,595 | 49.68% | 12,603 | 46.05% | 1,169 | 4.27% |
| 2004 | 17,670 | 51.51% | 16,313 | 47.55% | 323 | 0.94% |
| 2008 | 15,775 | 46.99% | 17,060 | 50.82% | 734 | 2.19% |
| 2012 | 16,831 | 53.28% | 13,826 | 43.77% | 934 | 2.96% |
| 2016 | 18,432 | 50.13% | 14,699 | 39.97% | 3,641 | 9.90% |
| 2020 | 20,803 | 49.44% | 20,282 | 48.20% | 994 | 2.36% |
| 2024 | 21,084 | 50.56% | 19,265 | 46.20% | 1,349 | 3.24% |
Education
The county's public schools are operated by Monongalia County Schools. The county is also home to West Virginia's largest university, West Virginia University, located in Morgantown.
Communities
Cities
- Morgantown (county seat)
- Westover
Towns
Magisterial districts
- Central
- Eastern
- Western
Census-designated places
Unincorporated communities
- Arnettsville
- Baker Ridge
- Behler
- Bertha Hill
- Bowlby
- Brewer Hill
- Browns Chapel
- Bula
- Canyon
- Cheat Neck
- Chestnut Ridge
- Clinton Furnace
- Core
- Crossroads
- Crown
- Daybrook
- Dellslow
- Delmar
- Easton
- Edna
- Everettville
- Fieldcrest
- Flaggy Meadow
- Fort Grand
- Fort Martin
- Georgetown
- Greer
- Greystone
- Gum Spring
- Hagans
- Halleck
- Harmony Grove
- Hilderbrand
- Hoard
- Hog Eye
- Holman
- Hunting Hills
- Jaco
- Jakes Run
- Jere
- Kimberly
- Klondike
- Laurel Point
- Little Falls
- Lowsville
- Macdale
- Maidsville
- Maple
- McCurdyville
- McMellin
- Miracle Run
- Mooresville
- Morgan Heights
- National
- New Hill
- Opekiska
- Osage
- Osgood
- Pedlar
- Pierpont
- Pioneer Rocks
- Price
- Price Hill
- Pursglove
- Ragtown
- Randall
- Richard
- Ridgedale
- Ringgold
- Rock Forge
- Rosedale
- Sabraton
- Saint Cloud
- Saint Leo
- Sandy
- Smithtown
- Stewartstown
- Suncrest Lake
- Sunnyside
- Sunset Beach
- Sturgisson
- The Mileground
- Triune
- Tyrone
- Uffington
- Van Voorhis
- Wadestown
- Wana
- West Sabraton
- West Van Voorhis
- Worley
See also
- National Register of Historic Places listings in Monongalia County, West Virginia
- Snake Hill Wildlife Management Area
- West Virginia University
- Murder of Skylar Neese
Other sources
- Core, Earl Lemley, The Monongalia Story: A Bicentennial History, Vol. I: Prelude (1974), Parsons, W.Va.: McClain Printing Co.
- Core, Earl Lemley, The Monongalia Story: A Bicentennial History, Vol. II: The Pioneers (1976), Parsons, West Virginia: McClain Printing Co.
- Core, Earl Lemley, The Monongalia Story: A Bicentennial History, Vol. III: Discord (1979), Parsons, West Virginia.: McClain Printing Co.
- Core, Earl Lemley, The Monongalia Story: A Bicentennial History, Vol. IV: Industrialization (1984), Parsons, West Virginia: McClain Printing Co.
- Core, Earl Lemley, The Monongalia Story: A Bicentennial History, Vol. V: Sophistication (1984), Parsons, West Virginia: McClain Printing Co.
References
- ^ a b "State & County QuickFacts". United States Census Bureau. Retrieved August 11, 2021.
- ^ "Find a County". National Association of Counties. Retrieved June 7, 2011.
- ^ West Virginia Counties Archived September 23, 2001, at the Wayback Machine. Wvculture.org. Retrieved on July 24, 2013.
- ^ Otis K. Rice & Stephen W. Brown, West Virginia: A History, 2nd ed., University Press of Kentucky, Lexington (1993), p. 240.
- ^ United States Census Bureau, U.S. Decennial Census, Tables of Minor Civil Divisions in West Virginia, 1870–2010.
- ^ "2023 Population Estimates (PEP)". United States Census Bureau. Retrieved February 22, 2026.
- ^ "U.S. Decennial Census". United States Census Bureau. Retrieved January 10, 2014.
- ^ "Historical Census Browser". University of Virginia Library. Retrieved January 10, 2014.
- ^ "Population of Counties by Decennial Census: 1900 to 1990". United States Census Bureau. Retrieved January 10, 2014.
- ^ "Census 2000 PHC-T-4. Ranking Tables for Counties: 1990 and 2000" (PDF). United States Census Bureau. Archived (PDF) from the original on October 9, 2022. Retrieved January 10, 2014.
- ^ a b c "2020 Decennial Census Demographic Profile (DP1)". United States Census Bureau. 2021. Retrieved 2025-12-01.
- ^ a b "2020 Decennial Census Redistricting Data (Public Law 94-171)". United States Census Bureau. 2021. Retrieved 2025-12-01.
- ^ a b "Explore Census Data". data.census.gov. Retrieved February 24, 2023.
- ^ "P004: Hispanic or Latino, and Not Hispanic or Latino by Race – 2000: DEC Summary File 1 – Monongalia County, West Virginia". United States Census Bureau.
- ^ "P2 Hispanic or Latino, and Not Hispanic or Latino by Race – 2010: DEC Redistricting Data (PL 94-171) - Monongalia County, West Virginia". United States Census Bureau.
- ^ "P2 Hispanic or Latino, and Not Hispanic or Latino by Race – 2020: DEC Redistricting Data (PL 94-171) - Monongalia County, West Virginia". United States Census Bureau.
- ^ a b c "DP-1 Profile of General Population and Housing Characteristics: 2010 Demographic Profile Data". United States Census Bureau. Retrieved April 3, 2016.
{{cite web}}: CS1 maint: deprecated archival service (link) - ^ "Population, Housing Units, Area, and Density: 2010 - County". United States Census Bureau. Retrieved April 3, 2016.
{{cite web}}: CS1 maint: deprecated archival service (link) - ^ "DP02 SELECTED SOCIAL CHARACTERISTICS IN THE UNITED STATES – 2006-2010 American Community Survey 5-Year Estimates". United States Census Bureau. Retrieved April 3, 2016.
{{cite web}}: CS1 maint: deprecated archival service (link) - ^ "DP03 SELECTED ECONOMIC CHARACTERISTICS – 2006-2010 American Community Survey 5-Year Estimates". United States Census Bureau. Retrieved April 3, 2016.
{{cite web}}: CS1 maint: deprecated archival service (link) - ^ "U.S. Census website". United States Census Bureau. Retrieved May 14, 2011.
- ^ "WV SOS - Elections - Election Results - Online Data Services". apps.sos.wv.gov. Retrieved August 22, 2021.
- ^ "Historical Election Results". www.monongaliacountyclerk.com. Retrieved August 22, 2021.
- ^ Leip, David. "Dave Leip's Atlas of U.S. Presidential Elections". uselectionatlas.org. Retrieved March 28, 2018.
External links
Places adjacent to Monongalia County, West Virginia | ||||||||||||||||
|---|---|---|---|---|---|---|---|---|---|---|---|---|---|---|---|---|
| ||||||||||||||||
39°38′N 80°03′W / 39.63°N 80.05°W
| International | |
|---|---|
| National | |
| Other | |