


Lampasas County, Texas
Lampasas County, Texas | |
|---|---|
 The Lampasas County Courthouse was completed in 1884. The structure was added to the National Register of Historic Places on June 21, 1971. | |
 Location within the U.S. state of Texas | |
| Coordinates: 31°11′N 98°14′W / 31.19°N 98.24°W | |
| Country | |
| State | |
| Founded | 1856 |
| Named after | Lampasas River |
| Seat | Lampasas |
| Largest city | Lampasas |
| Area | |
• Total | 714 sq mi (1,850 km2) |
| • Land | 713 sq mi (1,850 km2) |
| • Water | 1.1 sq mi (2.8 km2) 0.2% |
| Population (2020) | |
• Total | 21,627 |
| • Density | 30.3/sq mi (11.7/km2) |
| Time zone | UTC−6 (Central) |
| • Summer (DST) | UTC−5 (CDT) |
| Congressional district | 11th |
| Website | www |
Lampasas County (/læmˈpæsəs/ lam-PASS-əs) is a county located on the Edwards Plateau in the U.S. state of Texas. As of the 2020 census, its population was 21,627.[1] Its county seat is Lampasas.[2] The county is named for the Lampasas River. Lampasas County is part of the Killeen-Temple-Fort Hood metropolitan area.
History
Indigenous peoples were the first inhabitants of the area. Later known tribes in the area included Tonkawa, Lipan Apache, and Comanche.[3] The Aguayo expedition is said to have passed through the county in 1721.[4] In 1756, a presidio was established by Don Pedro de Terreros with the assistance of elements of the Spanish Army, at the confluence of Lucy Creek and Arroya Cavalto. The effort was abandoned not long after, but the site remained as a base of operations by Thomas Isaac Cox, a member of Terreros' original expedition, for the purpose of obtaining hundreds of Texas mustangs for use by the Continental Army during the American Revolutionary War.[5]
In 1853, Moses Hughes and his invalid wife, Hannah (Berry), became the first permanent settlers, seeking to take advantage of the medicinal springs.[6] John Patterson was the first man to cultivate land in the county, in 1854.[7] In 1855, Elizabeth and George W. Scott laid out the town of Burleson, named for her father. The town was renamed Lampasas, when it became the county seat;[3] the Sixth Texas Legislature formed Lampasas County, named after the Lampasas River, from parts of Travis, Bell, and Coryell Counties, in 1856.[6] In 1858 The northeastern corner of Lampasas County became part of Hamilton County.[3] In 1887 Mills County received northern and northwestern sections of Lampasas County.[3]
The Lampasas Guards were organized to ward off Indian attacks in 1859.[8] Indian raids increased in 1861, as able-bodied men were off fighting in the war.[6]
In 1872 Townsen's Mill was built by Perry and Jasper Townsen. This steam mill cut "rawhide" lumber and ground wheat and corn.[9] Henry A. Chadwick and son Milam built a sawmill, flour mill, and cotton gin in 1874.[10] In 1875, the Farmers' Alliance was formed in Lampasas in reaction against the cattle rustling and illegal land dealings prevalent in the county.[3][11] A gunfight occurred at the Lampasas Saloon in 1877.[12]
In 1882, the Gulf, Colorado and Santa Fe Railway extended its line west from Belton to Lampasas.[6] The Texas Power and Light Company arrived in Lampasas County in the 1920s,[3] and in 1934 the Lower Colorado River Authority brought electricity to the county.[3] Lone Star Gas established services in the county in 1949.[3]
During World War II in 1942, Fort Hood opened as a military training base. Hancock Park in Lampasas was temporarily turned over to the troops as a recreational area.[6]
In July of 2025, a major flood of the Lampasas River happened due to heavy rain upriver. The river level went from around 10 feet to a "major flood stage" of 33 feet. Numerous businesses were damaged, including Hancock Park and Thirsty Penguin. The Boy Scouts ferry system that was set up in that park was completely swept away. Evacuations in RV parks in the city of Kempner were mandatory.
Geography
According to the U.S. Census Bureau, the county has a total area of 714 sq mi (1,850 km2), of which 1.1 sq mi (2.8 km2) (0.2%) is covered by water.[13]
Major highways
Adjacent counties
- Hamilton County (north)
- Coryell County (northeast)
- Bell County (southeast)
- Burnet County (south)
- San Saba County (west)
- Mills County (northwest)
Demographics
| Census | Pop. | Note | %± |
|---|---|---|---|
| 1860 | 1,028 | — | |
| 1870 | 1,344 | 30.7% | |
| 1880 | 5,421 | 303.3% | |
| 1890 | 7,584 | 39.9% | |
| 1900 | 8,625 | 13.7% | |
| 1910 | 9,532 | 10.5% | |
| 1920 | 8,800 | −7.7% | |
| 1930 | 8,677 | −1.4% | |
| 1940 | 9,167 | 5.6% | |
| 1950 | 9,929 | 8.3% | |
| 1960 | 9,418 | −5.1% | |
| 1970 | 9,323 | −1.0% | |
| 1980 | 12,005 | 28.8% | |
| 1990 | 13,521 | 12.6% | |
| 2000 | 17,762 | 31.4% | |
| 2010 | 19,677 | 10.8% | |
| 2020 | 21,627 | 9.9% | |
| U.S. Decennial Census[14] 1850–2010[15] 2010[16] 2020[17] | |||
Racial and ethnic composition
| Race / Ethnicity (NH = Non-Hispanic) | Pop 2000[18] | Pop 2010[16] | Pop 2020[17] | % 2000 | % 2010 | % 2020 |
|---|---|---|---|---|---|---|
| White alone (NH) | 14,121 | 14,836 | 15,132 | 79.50% | 75.40% | 69.97% |
| Black or African American alone (NH) | 511 | 581 | 700 | 2.88% | 2.95% | 3.24% |
| Native American or Alaska Native alone (NH) | 88 | 127 | 115 | 0.50% | 0.65% | 0.53% |
| Asian alone (NH) | 126 | 184 | 242 | 0.71% | 0.94% | 1.12% |
| Pacific Islander alone (NH) | 8 | 35 | 86 | 0.05% | 0.18% | 0.40% |
| Some other race alone (NH) | 8 | 31 | 100 | 0.05% | 0.16% | 0.46% |
| Multiracial (NH) | 223 | 440 | 1,073 | 1.26% | 2.24% | 4.96% |
| Hispanic or Latino (any race) | 2,677 | 3,443 | 4,179 | 15.07% | 17.50% | 19.32% |
| Total | 17,762 | 19,677 | 21,627 | 100.00% | 100.00% | 100.00% |
2020 census
As of the 2020 census, the county had a population of 21,627. The median age was 44.7 years; 22.1% of residents were under 18 and 21.2% were 65 or older. For every 100 females, there were 98.1 males, and for every 100 females 18 and over, there were 96.7 males.[19][20]
The racial makeup of the county was 75.5% White, 3.4% Black or African American, 1.1% Native American and Alaska Native, 1.2% Asian, 0.4% Pacific Islander, 6.2% from some other race, and 12.2% from two or more races. Hispanic and Latino Americans of any race comprised 19.3% of the population.[20]
About 33.9% of residents lived in urban areas, while 66.1% lived in rural areas.[21]
Of the 8,486 households in the county, 29.6% had children under 18 living in them. Of all households, 54.9% were married-couple households, 16.9% were households with a single male householder, and 22.8% were households with a female householder with no husband present. About 24.5% of all households were made up of individuals, and 12.6% had someone living alone who was 65 or older.[19]
Of the 9,704 housing units, 12.6% were vacant. Among occupied housing units, 74.1% were owner-occupied and 25.9% were renter-occupied. The homeowner vacancy rate was 1.9% and the rental vacancy rate was 5.7%.[19]
2000 census
As of the 2000 census, 17,762 people, 6,554 households, and 4,876 families were residing in the county. The population density was 25 people/mi2 (9.7 people/km2). The 7,601 housing units averaged 11 units per square mile (4.2 units/km2). The racial makeup of the county was 86.75% White, 3.10% African American, 0.70% Native American, 0.75% Asian, 6.55% from other races, and 2.15% from two or more races. About 15.07% of the population was Hispanic or Latino of any race.[22]
Of the 6,554 households, 35.10% had children under 18 living with them, 60.70% were married couples living together, 9.50% had a female householder with no husband present, and 25.60% were not families. About 21.90% of all households were made up of individuals, and 10.50% had someone living alone who was 65 years of age or older. The average household size was 2.66, and the average family size was 3.08.
In the county, age distribution was 27.6% under 18, 7.7% from 18 to 24, 27.2% from 25 to 44, 23.0% from 45 to 64, and 14.5% who were 65 or older. The median age was 37 years. For every 100 females, there were 96.3 males. For every 100 females age 18 and over, there were 93.3 males.
The median income for a household in the county was $36,176 and for a family was $41,395. Males had a median income of $30,320 versus $20,637 for females. The per capita income for the county was $17,184. About 10.7% of families and 14.1% of the population were below the poverty line, including 18.7% of those under 18 and 14.8% of those 65 or over.
Communities
Cities
- Copperas Cove (mostly in Coryell County)
- Lampasas (county seat)
- Lometa
Unincorporated communities
- Adamsville
- Bend (partly in San Saba County)
- Izoro
- Moline (partly in Mills County)
- Nix
- Rumley
Ghost town
- Senterfitt
Politics
| Year | Republican | Democratic | Third party(ies) | |||
|---|---|---|---|---|---|---|
| No. | % | No. | % | No. | % | |
| 1912 | 81 | 10.42% | 654 | 84.17% | 42 | 5.41% |
| 1916 | 113 | 11.36% | 848 | 85.23% | 34 | 3.42% |
| 1920 | 227 | 16.84% | 778 | 57.72% | 343 | 25.45% |
| 1924 | 228 | 12.35% | 1,596 | 86.46% | 22 | 1.19% |
| 1928 | 899 | 60.91% | 567 | 38.41% | 10 | 0.68% |
| 1932 | 120 | 6.17% | 1,824 | 93.83% | 0 | 0.00% |
| 1936 | 134 | 8.38% | 1,462 | 91.43% | 3 | 0.19% |
| 1940 | 244 | 10.84% | 2,006 | 89.12% | 1 | 0.04% |
| 1944 | 212 | 10.26% | 1,693 | 81.95% | 161 | 7.79% |
| 1948 | 276 | 15.27% | 1,459 | 80.74% | 72 | 3.98% |
| 1952 | 1,478 | 55.21% | 1,199 | 44.79% | 0 | 0.00% |
| 1956 | 1,308 | 53.45% | 1,134 | 46.34% | 5 | 0.20% |
| 1960 | 1,222 | 46.84% | 1,372 | 52.59% | 15 | 0.57% |
| 1964 | 744 | 25.05% | 2,224 | 74.88% | 2 | 0.07% |
| 1968 | 935 | 33.18% | 1,423 | 50.50% | 460 | 16.32% |
| 1972 | 2,251 | 76.33% | 688 | 23.33% | 10 | 0.34% |
| 1976 | 1,563 | 39.25% | 2,376 | 59.67% | 43 | 1.08% |
| 1980 | 2,323 | 53.02% | 1,979 | 45.17% | 79 | 1.80% |
| 1984 | 3,285 | 70.60% | 1,356 | 29.14% | 12 | 0.26% |
| 1988 | 3,000 | 60.41% | 1,954 | 39.35% | 12 | 0.24% |
| 1992 | 2,233 | 43.07% | 1,508 | 29.08% | 1,444 | 27.85% |
| 1996 | 3,008 | 56.10% | 1,819 | 33.92% | 535 | 9.98% |
| 2000 | 4,526 | 72.84% | 1,569 | 25.25% | 119 | 1.92% |
| 2004 | 5,422 | 77.18% | 1,593 | 22.68% | 10 | 0.14% |
| 2008 | 5,651 | 74.02% | 1,903 | 24.93% | 80 | 1.05% |
| 2012 | 5,621 | 78.03% | 1,479 | 20.53% | 104 | 1.44% |
| 2016 | 6,385 | 77.82% | 1,483 | 18.07% | 337 | 4.11% |
| 2020 | 8,086 | 77.76% | 2,144 | 20.62% | 169 | 1.63% |
| 2024 | 8,961 | 79.15% | 2,232 | 19.72% | 128 | 1.13% |
| Year | Republican | Democratic | Third party(ies) | |||
|---|---|---|---|---|---|---|
| No. | % | No. | % | No. | % | |
| 2024 | 8,606 | 76.92% | 2,314 | 20.68% | 268 | 2.40% |
Education
School districts include:[25]
All of Lampasas County is in the service area of Central Texas College.[26]
See also
- List of museums in Central Texas
- National Register of Historic Places listings in Lampasas County, Texas
- Recorded Texas Historic Landmarks in Lampasas County
References
- ^ "Lampasas County, Texas". United States Census Bureau. Retrieved February 23, 2021.
- ^ "Find a County". National Association of Counties. Retrieved June 7, 2011.
- ^ a b c d e f g h Rhoades, Alice J. "Lampasas County". Handbook of Texas Online. Texas State Historical Association. Retrieved November 29, 2010.
- ^ Greene, A C (1998). Sketches from the Five States of Texas. TAMU Press. p. 18. ISBN 978-0-89096-853-6.
- ^ "Log into Facebook". Archived from the original on February 26, 2022.
{{cite web}}: Cite uses generic title (help) - ^ a b c d e Lampasas County Museum Foundation (2009). Lampasas County, TX. Arcadia Publishing. pp. 7–8. ISBN 978-0-7385-5881-3.
- ^ "John Patterson". Texas Historical Markers. William Nienke, Sam Morrow. Archived from the original on July 18, 2011. Retrieved November 29, 2010.
- ^ Anderson, Daniel; Yadon, Lawrence (2009). Ten Deadly Texans. Pelican Publishing. p. 105. ISBN 978-1-58980-599-6.
- ^ "Towsen's Mill". Texas Historical Markers. William Nienke, Sam Morrow. Archived from the original on July 18, 2011. Retrieved November 29, 2010.
- ^ "Chadwick's Mill". Texas Historical Markers. William Nienke, Sam Morrow. Archived from the original on July 18, 2011. Retrieved November 29, 2010.
- ^ "Pleasant Valley Farmers' Alliance No. 1". Texas Historical Markers. William Nienke, Sam Morrow. Archived from the original on March 14, 2012. Retrieved November 29, 2010.
- ^ "Gunfight at the Lampasas Saloon". Texas Historical Markers. William Nienke, Sam Morrow. Archived from the original on July 18, 2011. Retrieved November 29, 2010.
- ^ "2010 Census Gazetteer Files". United States Census Bureau. August 22, 2012. Retrieved May 3, 2015.
- ^ "Decennial Census of Population and Housing by Decade". US Census Bureau.
- ^ "Texas Almanac: Population History of Counties from 1850–2010" (PDF). Texas Almanac. Archived (PDF) from the original on October 9, 2022. Retrieved May 3, 2015.
- ^ a b "P2 Hispanic or Latino, and Not Hispanic or Latino by Race – 2010: DEC Redistricting Data (PL 94-171) – Lampasas County, Texas". United States Census Bureau.
- ^ a b "P2 Hispanic or Latino, and Not Hispanic or Latino by Race – 2020: DEC Redistricting Data (PL 94-171) – Lampasas County, Texas". United States Census Bureau.
- ^ "P004: Hispanic or Latino, and Not Hispanic or Latino by Race – 2000: DEC Summary File 1 – Lampasas County, Texas". United States Census Bureau.
- ^ a b c "2020 Decennial Census Demographic Profile (DP1)". United States Census Bureau. 2021. Retrieved January 10, 2026.
- ^ a b "2020 Decennial Census Redistricting Data (Public Law 94-171)". United States Census Bureau. 2021. Retrieved January 10, 2026.
- ^ "2020 Decennial Census Demographic and Housing Characteristics (DHC)". United States Census Bureau. 2023. Retrieved January 10, 2026.
- ^ "U.S. Census website". United States Census Bureau. Retrieved May 14, 2011.
- ^ Leip, David. "Dave Leip's Atlas of U.S. Presidential Elections". uselectionatlas.org. Retrieved July 26, 2018.
- ^ "2024 Senate Election (Official Returns)". Commonwealth of Texas by county. November 5, 2024. Retrieved December 5, 2024.
- ^ Geography Division (December 22, 2020). 2020 Census - School District Reference Map: Lampasas County, TX (PDF) (Map). Suitland, Maryland: U.S. Census Bureau. Retrieved January 13, 2026. - Text list
- ^ Sec. 130.171. CENTRAL TEXAS COLLEGE DISTRICT SERVICE AREA.
External links
- Lampasas County from the Handbook of Texas Online
Places adjacent to Lampasas County, Texas | ||||||||||||||||
|---|---|---|---|---|---|---|---|---|---|---|---|---|---|---|---|---|
| ||||||||||||||||
Municipalities and communities of Lampasas County, Texas, United States | ||
|---|---|---|
| Cities | 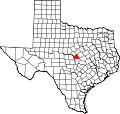 | |
| Unincorporated communities | ||
| Ghost towns | ||
| Footnotes | ‡This populated place also has portions in an adjacent county or counties | |
| International | |
|---|---|
| National | |
| Other | |