


St. Clair County, Missouri
St. Clair County, Missouri | |
|---|---|
 St. Clair County courthouse in Osceola | |
 Location within the U.S. state of Missouri | |
| Coordinates: 38°02′N 93°46′W / 38.04°N 93.77°W | |
| Country | |
| State | |
| Founded | January 29, 1841 |
| Named after | Arthur St. Clair |
| Seat | Osceola |
| Largest city | Appleton City |
| Area | |
• Total | 702 sq mi (1,820 km2) |
| • Land | 670 sq mi (1,700 km2) |
| • Water | 32 sq mi (83 km2) 4.6% |
| Population (2020) | |
• Total | 9,284 |
• Estimate (2024)[1] | 9,848 |
| • Density | 14.7/sq mi (5.7/km2) |
| Time zone | UTC−6 (Central) |
| • Summer (DST) | UTC−5 (CDT) |
| Congressional district | 4th |
| Website | www |
St. Clair County is a county located in the western portion of the U.S. state of Missouri. As of the 2020 census, the population was 9,284.[2] Its county seat is Osceola.[3] The largest city is Appleton City. The county was organized in 1841 and named after General Arthur St. Clair, Governor of the Northwest Territory.[4] St. Clair was also the 9th president of the United States in Congress Assembled. Under his presidency, the Northwest Ordinance and United States Constitution were passed.[5]
According to the April 1907 issue of The Century Magazine, for well over 30 years (dating from 1870) St. Clair County was in open rebellion against the U.S. Government, refusing to pay interest on bonds issued to assist in the building of a railroad that was never built.
Geography
According to the U.S. Census Bureau, the county has a total area of 702 square miles (1,820 km2), of which 670 square miles (1,700 km2) is land and 32 square miles (83 km2) (4.6%) is water.[6]
Adjacent counties
- Henry County (north)
- Benton County (northeast)
- Hickory County (east)
- Polk County (southeast)
- Cedar County (south)
- Vernon County (southwest)
- Bates County (northwest)
Major highways
Transit
Demographics
| Census | Pop. | Note | %± |
|---|---|---|---|
| 1850 | 3,556 | — | |
| 1860 | 6,812 | 91.6% | |
| 1870 | 6,742 | −1.0% | |
| 1880 | 14,125 | 109.5% | |
| 1890 | 16,747 | 18.6% | |
| 1900 | 17,907 | 6.9% | |
| 1910 | 16,412 | −8.3% | |
| 1920 | 15,341 | −6.5% | |
| 1930 | 13,289 | −13.4% | |
| 1940 | 13,146 | −1.1% | |
| 1950 | 10,482 | −20.3% | |
| 1960 | 8,421 | −19.7% | |
| 1970 | 7,667 | −9.0% | |
| 1980 | 8,622 | 12.5% | |
| 1990 | 8,457 | −1.9% | |
| 2000 | 9,652 | 14.1% | |
| 2010 | 9,805 | 1.6% | |
| 2020 | 9,284 | −5.3% | |
| 2024 (est.) | 9,848 | 6.1% | |
| U.S. Decennial Census[7] 1790–1960[8] 1900–1990[9] 1990–2000[10] 2010–2015[11] 2024[1] | |||
2020 census
As of the 2020 census, the county had a population of 9,284. The median age was 48.4 years, with 21.3% of residents under the age of 18 and 25.8% aged 65 or older. For every 100 females there were 102.7 males, and for every 100 females age 18 and over there were 101.3 males.[12]
The racial makeup of the county was 93.1% White, 0.3% Black or African American, 0.7% American Indian and Alaska Native, 0.2% Asian, 0.1% Native Hawaiian and Pacific Islander, 0.7% from some other race, and 4.9% from two or more races. Hispanic or Latino residents of any race comprised 1.9% of the population.[13]
| Race / Ethnicity (NH = Non-Hispanic) | Pop 1980[14] | Pop 1990[15] | Pop 2000[16] | Pop 2010[17] | Pop 2020[18] | % 1980 | % 1990 | % 2000 | % 2010 | % 2020 |
|---|---|---|---|---|---|---|---|---|---|---|
| White alone (NH) | 8,510 | 8,356 | 9,338 | 9,366 | 8,567 | 98.70% | 98.81% | 96.75% | 95.52% | 92.28% |
| Black or African American alone (NH) | 17 | 22 | 20 | 47 | 26 | 0.20% | 0.26% | 0.21% | 0.48% | 0.28% |
| Native American or Alaska Native alone (NH) | 58 | 41 | 72 | 58 | 63 | 0.67% | 0.48% | 0.75% | 0.59% | 0.68% |
| Asian alone (NH) | 5 | 5 | 14 | 12 | 19 | 0.06% | 0.06% | 0.15% | 0.12% | 0.20% |
| Native Hawaiian or Pacific Islander alone (NH) | x [19] | x [20] | 2 | 1 | 7 | x | x | 0.02% | 0.01% | 0.08% |
| Other race alone (NH) | 0 | 0 | 4 | 1 | 23 | 0.00% | 0.00% | 0.04% | 0.01% | 0.25% |
| Mixed race or Multiracial (NH) | x [21] | x [22] | 107 | 150 | 401 | x | x | 1.11% | 1.53% | 4.32% |
| Hispanic or Latino (any race) | 32 | 33 | 95 | 170 | 178 | 0.37% | 0.39% | 0.98% | 1.73% | 1.92% |
| Total | 8,622 | 8,457 | 9,652 | 9,805 | 9,284 | 100.00% | 100.00% | 100.00% | 100.00% | 100.00% |
0.0% of residents lived in urban areas, while 100.0% lived in rural areas.[23]
There were 3,928 households in the county, of which 23.3% had children under the age of 18 living with them and 23.3% had a female householder with no spouse or partner present. About 31.8% of all households were made up of individuals and 17.1% had someone living alone who was 65 years of age or older.[12]
There were 5,288 housing units, of which 25.7% were vacant. Among occupied housing units, 76.0% were owner-occupied and 24.0% were renter-occupied. The homeowner vacancy rate was 1.6% and the rental vacancy rate was 10.7%.[12]
2000 census
As of the census[24] of 2000, there were 9,652 people, 4,040 households, and 2,791 families residing in the county. The population density was 14 people per square mile (5.4 people/km2). There were 5,205 housing units at an average density of 8 units per square mile (3.1/km2). The racial makeup of the county was 97.36% White, 0.23% Black or African American, 0.75% Native American, 0.15% Asian, 0.02% Pacific Islander, 0.29% from other races, and 1.21% from two or more races. Approximately 0.98% of the population were Hispanic or Latino of any race.
There were 4,040 households, out of which 26.30% had children under the age of 18 living with them, 57.60% were married couples living together, 7.70% had a female householder with no husband present, and 30.90% were non-families. 27.40% of all households were made up of individuals, and 14.80% had someone living alone who was 65 years of age or older. The average household size was 2.34 and the average family size was 2.83.
In the county, the population was spread out, with 23.00% under the age of 18, 5.60% from 18 to 24, 22.90% from 25 to 44, 27.20% from 45 to 64, and 21.30% who were 65 years of age or older. The median age was 44 years. For every 100 females there were 98.60 males. For every 100 females age 18 and over, there were 94.30 males.
The median income for a household in the county was $25,321, and the median income for a family was $31,498. Males had a median income of $23,231 versus $18,351 for females. The per capita income for the county was $14,025. About 16.20% of families and 19.60% of the population were below the poverty line, including 25.30% of those under age 18 and 17.60% of those age 65 or over.
Education
Public schools
- Appleton City R-II School District – Appleton City
- Appleton City Elementary School (K–5)
- Appleton City High School (06-12)
- Hudson R-IX School District – Appleton City
- Hudson Elementary School (PK–8)
- Osceola Public Schools – Osceola
- Osceola Elementary School (PK–6)
- Osceola High School (7–12)
- Roscoe C-1 School District – Roscoe
- Roscoe Elementary School (PK–8)
- Lakeland R-III School District – Lowry City & Deepwater
- Lakeland Elementary School
Public libraries
- Appleton City Public Library
- St. Clair County Library-Main Library (Osceola)
- St. Clair County Library-Lowry City Branch
Communities
Cities
- Appleton City
- Lowry City
- Osceola (county seat)
Villages
Unincorporated communities
Townships
St. Clair County is divided into 16 townships:
Politics
Local
The Republican Party predominantly controls politics at the local level in St. Clair County.
| St. Clair County, Missouri | |||
|---|---|---|---|
| Elected countywide officials | |||
| Assessor | George Lysinger | Republican | |
| Circuit Clerk | Karen Hubbard | Democratic | |
| County Clerk | Holly Fletcher | Republican | |
| Collector | Pam Guffey | Republican | |
| Commissioner (presiding) | Robert Salmon | Republican | |
| Commissioner (district 1) | Matt Noakes | Republican | |
| Commissioner (district 2) | Randy Smith | Republican | |
| Coroner | C. Randy Shelton | Republican | |
| Prosecuting Attorney | Daniel Dysart | Republican | |
| Public Administrator | David Knight | Republican | |
| Recorder | Mandy Jackson | Republican | |
| Sheriff | Lee Hilty | Republican | |
| Treasurer | Rhonda Shelby | Republican | |
State
| Year | Republican | Democratic | Third Parties |
|---|---|---|---|
| 2024 | 78.01% 3,887 | 20.11% 1,002 | 1.88% 94 |
| 2020 | 78.01% 3,880 | 20.00% 995 | 1.99% 99 |
| 2016 | 62.86% 2,927 | 33.51% 1,560 | 3.63% 169 |
| 2012 | 50.33% 2,335 | 45.72% 2,121 | 3.95% 183 |
| 2008 | 41.90% 2,093 | 54.73% 2,734 | 3.36% 168 |
| 2004 | 58.21% 2,888 | 40.40% 2,004 | 1.39% 69 |
| 2000 | 50.73% 2,405 | 47.35% 2,245 | 1.92% 91 |
| 1996 | 42.91% 1,909 | 54.37% 2,419 | 2.72% 121 |
All of St. Clair County is a part of Missouri's 125th District in the Missouri House of Representatives and is represented by Warren Love (R-Osceola).
| Party | Candidate | Votes | % | ±% | |
|---|---|---|---|---|---|
| Republican | Warren D. Love | 3,965 | 100.00% | ||
| Party | Candidate | Votes | % | ±% | |
|---|---|---|---|---|---|
| Republican | Warren D. Love | 2,447 | 100.00% | ||
| Party | Candidate | Votes | % | ±% | |
|---|---|---|---|---|---|
| Republican | Warren D. Love | 3,685 | 100.00% | ||
All of St. Clair County is a part of Missouri's 28th District in the Missouri Senate. The seat is currently Held by Sandy Crawford.
| Party | Candidate | Votes | % | ±% | |
|---|---|---|---|---|---|
| Republican | Mike Parson | 2,616 | 100.00% | ||
Federal
| Party | Candidate | Votes | % | ±% | |
|---|---|---|---|---|---|
| Republican | Roy Blunt | 2,941 | 63.19% | +17.07 | |
| Democratic | Jason Kander | 1,460 | 31.37% | −14.08 | |
| Libertarian | Jonathan Dine | 138 | 2.97% | −5.46 | |
| Green | Johnathan McFarland | 45 | 0.97% | +0.97 | |
| Constitution | Fred Ryman | 70 | 1.50% | +1.50 | |
| Party | Candidate | Votes | % | ±% | |
|---|---|---|---|---|---|
| Republican | Todd Akin | 2,132 | 46.12% | ||
| Democratic | Claire McCaskill | 2,101 | 45.45% | ||
| Libertarian | Jonathan Dine | 390 | 8.43% | ||
All of St. Clair County is included in Missouri's 4th Congressional District and is currently represented by Vicky Hartzler (R-Harrisonville) in the U.S. House of Representatives.
| Party | Candidate | Votes | % | ±% | |
|---|---|---|---|---|---|
| Republican | Vicky Hartzler | 3,438 | 74.59% | +1.25 | |
| Democratic | Gordon Christensen | 993 | 21.55% | −0.73 | |
| Libertarian | Mark Bliss | 178 | 3.86% | −0.52 | |
| Party | Candidate | Votes | % | ±% | |
|---|---|---|---|---|---|
| Republican | Vicky Hartzler | 2,278 | 73.34% | +7.37 | |
| Democratic | Nate Irvin | 692 | 22.28% | −8.03 | |
| Libertarian | Herschel L. Young | 136 | 4.38% | +1.73 | |
| Party | Candidate | Votes | % | ±% | |
|---|---|---|---|---|---|
| Republican | Vicky Hartzler | 3,036 | 65.97% | ||
| Democratic | Teresa Hensley | 1,395 | 30.31% | ||
| Libertarian | Thomas Holbrook | 122 | 2.65% | ||
| Constitution | Greg Cowan | 49 | 1.07% | ||
Political culture
| Year | Republican | Democratic | Third party(ies) | |||
|---|---|---|---|---|---|---|
| No. | % | No. | % | No. | % | |
| 1888 | 1,635 | 44.33% | 1,697 | 46.01% | 356 | 9.65% |
| 1892 | 1,510 | 40.79% | 1,572 | 42.46% | 620 | 16.75% |
| 1896 | 1,829 | 40.30% | 2,686 | 59.19% | 23 | 0.51% |
| 1900 | 1,844 | 44.91% | 2,036 | 49.59% | 226 | 5.50% |
| 1904 | 1,895 | 49.65% | 1,761 | 46.14% | 161 | 4.22% |
| 1908 | 1,723 | 46.50% | 1,877 | 50.66% | 105 | 2.83% |
| 1912 | 1,046 | 28.14% | 1,710 | 46.00% | 961 | 25.85% |
| 1916 | 1,718 | 45.80% | 1,881 | 50.15% | 152 | 4.05% |
| 1920 | 3,249 | 56.94% | 2,296 | 40.24% | 161 | 2.82% |
| 1924 | 2,907 | 49.70% | 2,640 | 45.14% | 302 | 5.16% |
| 1928 | 3,846 | 68.88% | 1,701 | 30.46% | 37 | 0.66% |
| 1932 | 2,271 | 37.71% | 3,681 | 61.13% | 70 | 1.16% |
| 1936 | 3,351 | 50.13% | 3,302 | 49.40% | 31 | 0.46% |
| 1940 | 3,950 | 57.80% | 2,859 | 41.83% | 25 | 0.37% |
| 1944 | 3,306 | 60.87% | 2,119 | 39.02% | 6 | 0.11% |
| 1948 | 2,548 | 50.52% | 2,489 | 49.35% | 7 | 0.14% |
| 1952 | 3,465 | 64.17% | 1,914 | 35.44% | 21 | 0.39% |
| 1956 | 3,018 | 57.84% | 2,200 | 42.16% | 0 | 0.00% |
| 1960 | 3,196 | 63.15% | 1,865 | 36.85% | 0 | 0.00% |
| 1964 | 1,961 | 43.06% | 2,593 | 56.94% | 0 | 0.00% |
| 1968 | 2,271 | 54.36% | 1,496 | 35.81% | 411 | 9.84% |
| 1972 | 2,847 | 66.88% | 1,410 | 33.12% | 0 | 0.00% |
| 1976 | 1,808 | 44.07% | 2,271 | 55.35% | 24 | 0.58% |
| 1980 | 2,419 | 57.46% | 1,706 | 40.52% | 85 | 2.02% |
| 1984 | 2,667 | 61.71% | 1,655 | 38.29% | 0 | 0.00% |
| 1988 | 2,312 | 55.27% | 1,864 | 44.56% | 7 | 0.17% |
| 1992 | 1,555 | 33.72% | 1,965 | 42.62% | 1,091 | 23.66% |
| 1996 | 1,815 | 40.58% | 1,974 | 44.13% | 684 | 15.29% |
| 2000 | 2,731 | 57.63% | 1,866 | 39.38% | 142 | 3.00% |
| 2004 | 3,098 | 62.40% | 1,841 | 37.08% | 26 | 0.52% |
| 2008 | 2,981 | 59.76% | 1,886 | 37.81% | 121 | 2.43% |
| 2012 | 3,019 | 65.26% | 1,460 | 31.56% | 147 | 3.18% |
| 2016 | 3,501 | 75.62% | 936 | 20.22% | 193 | 4.17% |
| 2020 | 3,932 | 79.05% | 988 | 19.86% | 54 | 1.09% |
| 2024 | 3,982 | 79.61% | 959 | 19.17% | 61 | 1.22% |
See also
References
- ^ a b "St. Clair County, Missouri". Census.gov.
- ^ "Explore Census Data". data.census.gov. Retrieved December 27, 2021.
- ^ "Find a County". National Association of Counties. Retrieved June 7, 2011.
- ^ Eaton, David Wolfe (1918). How Missouri Counties, Towns and Streams Were Named. The State Historical Society of Missouri. pp. 357.
- ^ Klos, Stanley L. (2004). "Arthur St. Clair". President Who? Forgotten Founders. Pittsburgh, Pennsylvania: Evisum, Inc. pp. 367–422. ISBN 0-9752627-5-0.
- ^ "2010 Census Gazetteer Files". United States Census Bureau. August 22, 2012. Archived from the original on October 21, 2013. Retrieved November 20, 2014.
- ^ "U.S. Decennial Census". United States Census Bureau. Retrieved November 20, 2014.
- ^ "Historical Census Browser". University of Virginia Library. Retrieved November 20, 2014.
- ^ "Population of Counties by Decennial Census: 1900 to 1990". United States Census Bureau. Retrieved November 20, 2014.
- ^ "Census 2000 PHC-T-4. Ranking Tables for Counties: 1990 and 2000" (PDF). United States Census Bureau. Archived (PDF) from the original on March 27, 2010. Retrieved November 20, 2014.
- ^ "State & County QuickFacts". United States Census Bureau. Retrieved September 14, 2013.
- ^ a b c "2020 Decennial Census Demographic Profile (DP1)". United States Census Bureau. 2021. Retrieved December 18, 2025.
- ^ "2020 Decennial Census Redistricting Data (Public Law 94-171)". United States Census Bureau. 2021. Retrieved December 18, 2025.
- ^ "1980 Census of Population - General Social and Economic Characteristics - Missouri- Table 16 - Persons by Spanish Origin, Race, and Sex: 1980" (PDF). United States Census Bureau. p. 20-25.
- ^ "1990 Census of Population - General Population Characteristics - Missouri: Table 5 - Race and Hispanic Origin" (PDF). United States Census Bureau. p. 13-63.
- ^ "P004: Hispanic or Latino, and Not Hispanic or Latino by Race – 2000: DEC Summary File 1 – St. Clair County, Missouri". United States Census Bureau.
- ^ "P2: Hispanic or Latino, and Not Hispanic or Latino by Race – 2010: DEC Redistricting Data (PL 94-171) – St. Clair County, Missouri". United States Census Bureau.
- ^ "P2: Hispanic or Latino, and Not Hispanic or Latino by Race – 2020: DEC Redistricting Data (PL 94-171) – St. Clair County, Missouri". United States Census Bureau.
- ^ included in the Asian category in the 1980 Census
- ^ included in the Asian category in the 1990 Census
- ^ not an option in the 1980 Census
- ^ not an option in the 1990 Census
- ^ "2020 Decennial Census Demographic and Housing Characteristics (DHC)". United States Census Bureau. 2023. Retrieved December 18, 2025.
- ^ "U.S. Census website". United States Census Bureau. Retrieved January 31, 2008.
- ^ Leip, David. "Dave Leip's Atlas of U.S. Presidential Elections". uselectionatlas.org. Retrieved March 26, 2018.
External links
- Digitized 1930 Plat Book of St. Clair County Archived August 16, 2011, at the Wayback Machine from University of Missouri Division of Special Collections, Archives, and Rare Books
- St.Clair County Sheriff's Office
Places adjacent to St. Clair County, Missouri | ||||||||||||||||
|---|---|---|---|---|---|---|---|---|---|---|---|---|---|---|---|---|
| ||||||||||||||||
Municipalities and communities of St. Clair County, Missouri, United States | ||
|---|---|---|
| Cities | 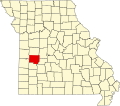 | |
| Villages | ||
| Townships | ||
| Unincorporated communities | ||
| Ghost towns | ||
| International | |
|---|---|
| National | |
| Other | |