


Size of this PNG preview of this SVG file: 360 × 288 pixels. Other resolutions: 300 × 240 pixels | 600 × 480 pixels | 960 × 768 pixels | 1,280 × 1,024 pixels | 2,560 × 2,048 pixels.
Original file (SVG file, nominally 360 × 288 pixels, file size: 36 KB)
Summary
| Description |
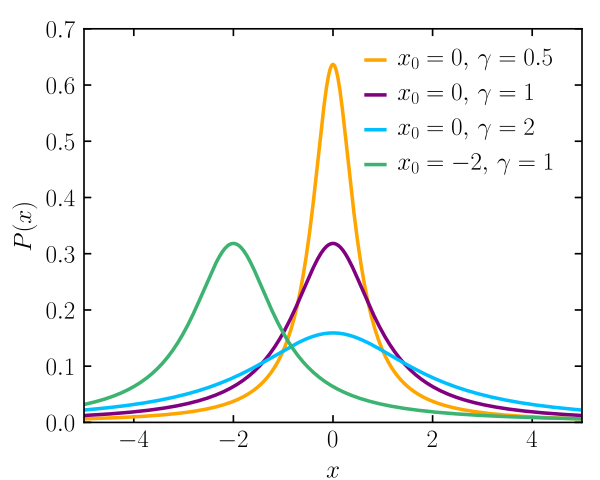
English: Plots of the density functions for several members of the Cauchy family of probability distributions. |
| Date | |
| Source | Own work |
| Author | Skbkekas |
| SVG development | This plot was created with Matplotlib. |
| Source code | Python code#!/usr/bin/python
import numpy as np
import matplotlib.pyplot as plt
import scipy.special as sp
import matplotlib.font_manager
col = ['orange', 'purple', 'deepskyblue', 'mediumseagreen']
X = np.arange(-5, 5, 0.01)
##
## PDF
##
plt.rc('text', usetex = True)
plt.rc('font', family = 'serif', size = 12)
plt.clf()
plt.figure(figsize=(4,3.2))
plt.axes([0.14,0.12,0.83,0.82])
# plt.hold(True)
X = np.arange(-5, 5, 0.01)
A = []
for k,(x,g) in enumerate([(0,0.5),(0,1),(0,2),(-2,1)]):
Y = ((X-x)/g)**2 + 1
Y = 1/(np.pi*g*Y)
a = plt.plot(X, Y, '-', color=col[k], lw=1.7)
A.append(a)
plt.xlabel("$x$")
plt.ylabel("$P(x)$")
plt.ylim([0,0.7])
plt.tick_params(direction='in', top=True, right=True)
prop = matplotlib.font_manager.FontProperties(size=12)
# bx =
plt.legend(("$x_0=0,\\, \\gamma=0.5$", "$x_0=0,\\,\\gamma=1$",\
"$x_0=0,\\, \\gamma=2$", "$x_0=-2,\\, \\gamma=1$"),
numpoints=1, handlelength=0.75, handletextpad=0.5,\
loc="upper right", frameon=False)
# bx.draw_frame(False)
plt.xlim(-5,5)
plt.savefig("cauchy_pdf.pdf")
plt.savefig("cauchy_pdf.svg")
|
Licensing
I, the copyright holder of this work, hereby publish it under the following license:
This file is licensed under the Creative Commons Attribution 3.0 Unported license.
- You are free:
- to share – to copy, distribute and transmit the work
- to remix – to adapt the work
- Under the following conditions:
- attribution – You must give appropriate credit, provide a link to the license, and indicate if changes were made. You may do so in any reasonable manner, but not in any way that suggests the licensor endorses you or your use.
File history
Click on a date/time to view the file as it appeared at that time.
| Date/Time | Thumbnail | Dimensions | User | Comment | |
|---|---|---|---|---|---|
| current | 02:25, 21 November 2020 | | 360 × 288 (36 KB) | AkanoToE | Made all text LaTeX, spacing in legend more aesthetic. |
| 15:23, 4 March 2010 |  | 360 × 288 (39 KB) | Skbkekas | {{Information |Description={{en|1=Plots of the density functions for several members of the Cauchy family of probability distributions.}} |Source={{own}} |Author=Skbkekas |Date=2010-03-02 |Permission= |other_versions= }} [[Category:Stat |
File usage
The following 3 pages use this file:
Global file usage
The following other wikis use this file:
- Usage on ar.wikipedia.org
- Usage on be.wikipedia.org
- Usage on ca.wikipedia.org
- Usage on de.wikipedia.org
- Usage on de.wikiversity.org
- Usage on en.wikiquote.org
- Usage on en.wiktionary.org
- Usage on es.wikipedia.org
- Usage on fa.wikipedia.org
- Usage on fi.wikipedia.org
- Usage on fr.wikipedia.org
- Usage on hi.wikipedia.org
- Usage on it.wikipedia.org
- Usage on ko.wikipedia.org
- Usage on oc.wikipedia.org
- Usage on pt.wikipedia.org
- Usage on sl.wikipedia.org
- Usage on sq.wikipedia.org
- Usage on tr.wikipedia.org
- Usage on uk.wikipedia.org
- Usage on www.wikidata.org
You must be logged in to post a comment.