


Size of this PNG preview of this SVG file: 283 × 230 pixels. Other resolutions: 295 × 240 pixels | 591 × 480 pixels | 945 × 768 pixels | 1,260 × 1,024 pixels | 2,520 × 2,048 pixels.
Original file (SVG file, nominally 283 × 230 pixels, file size: 7 KB)
Summary
| Description |
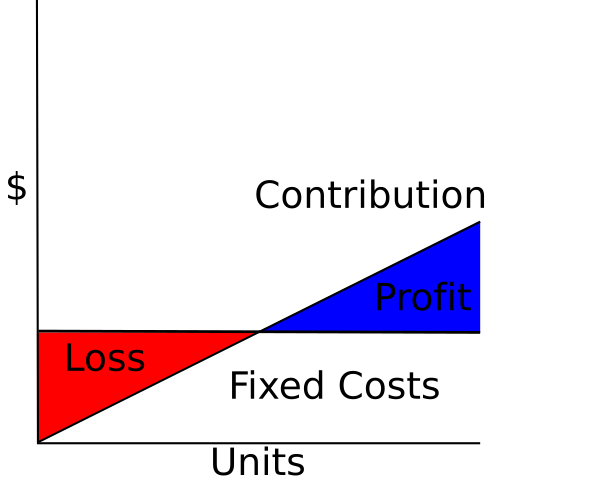
English: Cost-Volume-Profit diagram, showing relationship between Fixed Costs, Contribution, and Profit and Loss. |
||
| Date | |||
| Source |
Self-made in Inkscape. This W3C-unspecified vector image was created with Inkscape . |
||
| Author | Nils R. Barth | ||
| Permission (Reusing this file) |
Nils R. Barth, the copyright holder of this work, hereby publishes it under the following license:
|

|
This SVG file contains embedded text that can be translated into your language, using any capable SVG editor, text editor or the SVG Translate tool. For more information see: About translating SVG files. |
File history
Click on a date/time to view the file as it appeared at that time.
| Date/Time | Thumbnail | Dimensions | User | Comment | |
|---|---|---|---|---|---|
| current | 21:15, 3 February 2008 | | 283 × 230 (7 KB) | Nbarth | {{Information |Description= |Source=self-made |Date= |Author= Nbarth |Permission= |other_versions= }} |
File usage
The following 2 pages use this file:
Global file usage
The following other wikis use this file:
- Usage on id.wikipedia.org
You must be logged in to post a comment.