


Size of this preview: 800 × 409 pixels. Other resolutions: 320 × 163 pixels | 640 × 327 pixels | 963 × 492 pixels.
Original file (963 × 492 pixels, file size: 6 KB, MIME type: image/png)
Summary
| Description |
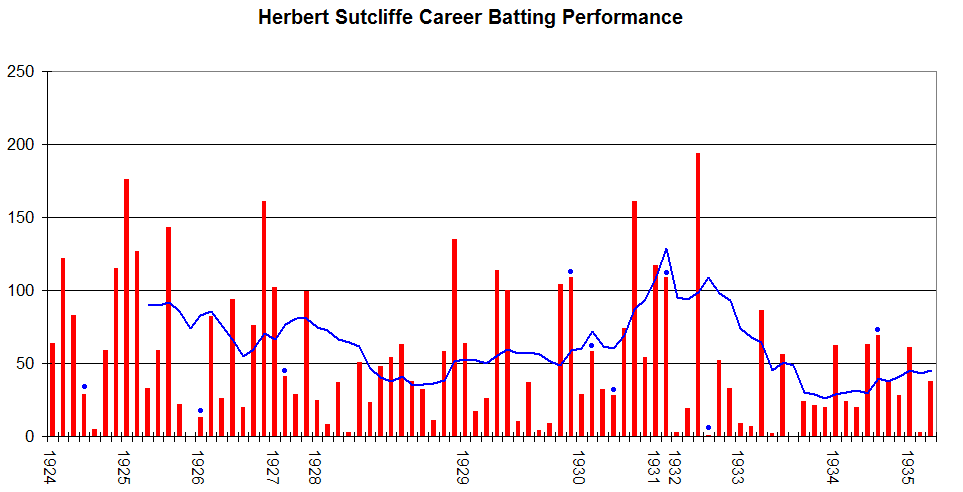
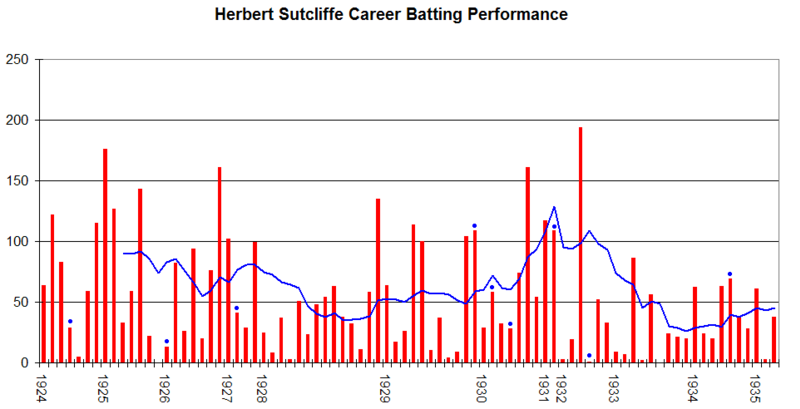
English: This graph details the Test Match performance of Herbert Sutcliffe. It was created by Raven4x4x. The red bars indicate the player's test match innings, while the blue line shows the average of the ten most recent innings at that point. Note that this average cannot be calculated for the first nine innings. The blue dots indicate innings in which Sutcliffe finished not-out.
This graph was generated with Microsoft Excel 2002, using data from Cricinfo and Howstat.com.au. |
| Date | 29 October 2005 (original upload date) |
| Source |
Own work Transferred from en.wikipedia |
| Author | Raven4x4x at en.wikipedia |
Licensing
| |
This work has been released into the public domain by its author, Raven4x4x, at the English Wikipedia project. This applies worldwide. In case this is not legally possible: |
Original upload log
The original description page was here. All following user names refer to en.wikipedia.
- 2005-10-29 01:22 Raven4x4x 963×492 (6937 bytes) This graph details the [[Test cricket|Test Match]] performance of [[Herbert Sutcliffe]]. The red bars indicate the player's test match innings, while the blue line shows the [[Batting average|average]] of the ten most recent innings at that point. Note th
- 2005-11-14 01:38 Raven4x4x 963×492 (6540 bytes) Removed unwanted grey line at edge
- 2006-02-08 03:38 Raven4x4x 963×492 (6283 bytes) Updated to fix x axis labelling
File history
Click on a date/time to view the file as it appeared at that time.
| Date/Time | Thumbnail | Dimensions | User | Comment | |
|---|---|---|---|---|---|
| current | 22:23, 27 July 2010 | | 963 × 492 (6 KB) | MGA73bot2 | == {{int:filedesc}} == {{Information |description={{en|1=This graph details the Test Match performance of Herbert Sutcliffe. It was created by Raven4x4x. The red bars indicate the playe |
File usage
The following page uses this file:
You must be logged in to post a comment.