


Size of this PNG preview of this SVG file: 700 × 400 pixels. Other resolutions: 320 × 183 pixels | 640 × 366 pixels | 1,024 × 585 pixels | 1,280 × 731 pixels | 2,560 × 1,463 pixels.
Original file (SVG file, nominally 700 × 400 pixels, file size: 50 KB)
Summary
| Description | |
| Date | |
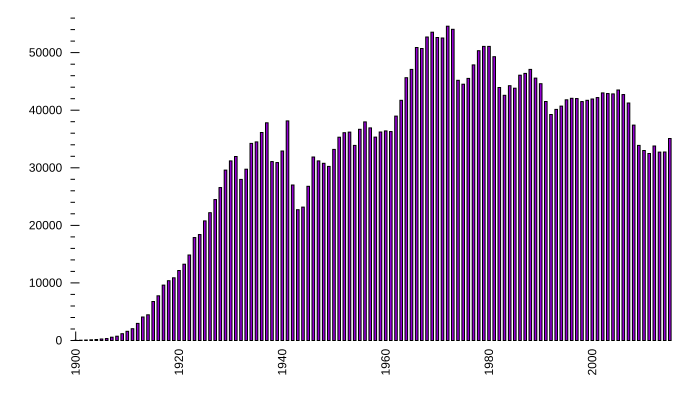
| Source | generated with gnuplot from the data at File:Motor vehicle deaths in the US.svg, but with own bar chart settings |
| Author | User:Kopiersperre |
| Other versions | File:Motor vehicle deaths in the US.svg |
gnuplot source
|
|---|
set terminal svg size 700,400

set yrange [0:56000]
set xrange [1899:2016]
set xtics rotate by 90 right
set mytics 5

unset border
set xtics nomirror
set ytics nomirror
set style fill solid 1.0
set style fill solid border -1
set boxwidth 0.5

set output "Motor vehicle deaths in the US histogram.svg"

plot "usa.dat" u 1:2 with boxes title ""
|
(File "usa.dat" is shown at File:Motor_vehicle_deaths_in_the_US.svg#usa.dat.)
Licensing
(License inherited from original file:)
I, the copyright holder of this work, hereby publish it under the following license:
| I, the copyright holder of this work, release this work into the public domain. This applies worldwide. In some countries this may not be legally possible; if so: I grant anyone the right to use this work for any purpose, without any conditions, unless such conditions are required by law. |
File history
Click on a date/time to view the file as it appeared at that time.
| Date/Time | Thumbnail | Dimensions | User | Comment | |
|---|---|---|---|---|---|
| current | 09:40, 5 December 2018 | | 700 × 400 (50 KB) | Jochen Burghardt | User created page with UploadWizard |
File usage
The following page uses this file:
Global file usage
The following other wikis use this file:
- Usage on ja.wikipedia.org