


Original file (844 × 637 pixels, file size: 49 KB, MIME type: image/png)
Summary
| Description |
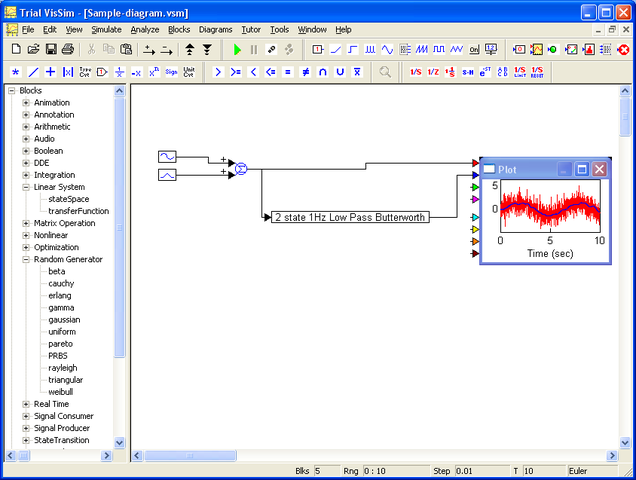
English: Screenshot of VisSim viewer showing a sinusoid with random noise added, connected to a plot diagram (red plot). An extra block with a Butterworth filter is added to optimize the output (blue line).
Русский: Скриншот программы VisSim, отображающий синусоиду с добавлением случайного шума(красный график). Дополнительный блок в виде фильтра Баттерворта добавлен для сглаживания выходного сигнала(синяя линия) Español: Captura de pantalla. Français : Capture d'écran. |
| Date | 22 dec 2009 (original screenshot date) |
| Source |
Own work This image was created with VisSim. |
| Author | DSP-user |
| Permission (Reusing this file) |
English: The VisSim viewer is released under the free software license BSD.
I built this (mini) model with VisSim built-in functions. The VisSim viewer is copyrighted by Visual Solutions Inc. |
| Other versions |
English: Screencast version(640x320 pixels).
Русский: Скринкастинг. |
Licensing
This screenshot either does not contain copyright-eligible parts or visuals of copyrighted software, or the author has released it under a free license (which should be indicated beneath this notice), and as such follows the licensing guidelines for screenshots of Wikimedia Commons. You may use it freely according to its particular license. Free software license:
| Copyright © Visual Solutions
Redistribution and use in source and binary forms, with or without modification, are permitted provided that the following conditions are met:
This software is provided by Visual Solutions "as is" and any express or implied warranties, including, but not limited to, the implied warranties of merchantability and fitness for a particular purpose are disclaimed. In no event shall Visual Solutions be liable for any direct, indirect, incidental, special, exemplary, or consequential damages (including, but not limited to, procurement of substitute goods or services; loss of use, data, or profits; or business interruption) however caused and on any theory of liability, whether in contract, strict liability, or tort (including negligence or otherwise) arising in any way out of the use of this software, even if advised of the possibility of such damage.
|
Note: if the screenshot shows any work that is not a direct result of the program code itself, such as a text or graphics that are not part of the program, the license for that work must be indicated separately.
File history
Click on a date/time to view the file as it appeared at that time.
| Date/Time | Thumbnail | Dimensions | User | Comment | |
|---|---|---|---|---|---|
| current | 18:23, 22 December 2009 | | 844 × 637 (49 KB) | DSP-user | {{Information |Description=Screenshot of VisSim viewer showing a sinusoid with random noise added, connected to a plot diagram (red plot). An extra block with a Butterworth filter is added to optimize the output (blue line). |Source=Self taken screenshot |
File usage
The following page uses this file:
Global file usage
The following other wikis use this file:
- Usage on de.wikipedia.org
- Usage on en.wikibooks.org
- Usage on es.wikipedia.org
- Usage on fr.wikipedia.org
- Usage on id.wikipedia.org
- Usage on nl.wikipedia.org
- Usage on ru.wikipedia.org
- Usage on uk.wikipedia.org
- Usage on www.wikidata.org