


Welwyn Hatfield Borough Council elections
One third of Welwyn Hatfield Borough Council in Hertfordshire, England is elected each year, followed by one year without election. Since the last boundary changes in 2016 the council has comprised 48 councillors representing 16 wards, each of which elects three councillors.[1]
Council elections
| Year | Conservative | Labour | Liberal Democrats[a] | Independents & Others |
Council control after election | |||
|---|---|---|---|---|---|---|---|---|
| Local government reorganisation; council established (43 seats) | ||||||||
| 1973 | 19 | 24 | 0 | 0 | Labour | |||
| New ward boundaries (43 seats)[3] | ||||||||
| 1976 | 24 | 19 | 0 | 0 | Conservative | |||
| 1978 | 23 | 20 | 0 | 0 | Conservative | |||
| 1979 | 21 | 22 | 0 | 0 | Labour | |||
| 1980 | 18 | 25 | 0 | 0 | Labour | |||
| 1982 | 18 | 25 | 0 | 0 | Labour | |||
| 1983 | 19 | 24 | 0 | 0 | Labour | |||
| 1984 | 19 | 24 | 0 | 0 | Labour | |||
| 1986[4] | 17 | 24 | 2 | 0 | Labour | |||
| 1987 | 18 | 23 | 2 | 0 | Labour | |||
| 1988 | 19 | 22 | 2 | 0 | Labour | |||
| 1990 | 19 | 24 | 0 | 0 | Labour | |||
| New ward boundaries (47 seats)[5] | ||||||||
| 1991 | 21 | 26 | 0 | 0 | Labour | |||
| 1992 | 24 | 23 | 0 | 0 | Conservative | |||
| 1994[6] | 23 | 24 | 0 | 0 | Labour | |||
| 1995 | 20 | 27 | 0 | 0 | Labour | |||
| 1996 | 16 | 31 | 0 | 0 | Labour | |||
| 1998 | 20 | 27 | 0 | 0 | Labour | |||
| New ward boundaries (48 seats)[7][8] | ||||||||
| 1999 | 24 | 21 | 0 | 0[b] | No overall control | |||
| 2000 | 23 | 25 | 0 | 0 | Labour | |||
| 2002 | 26 | 22 | 0 | 0 | Conservative | |||
| 2003 | 27 | 21 | 0 | 0 | Conservative | |||
| 2004 | 31 | 15 | 2 | 0 | Conservative | |||
| 2006 | 32 | 12 | 3 | 1 | Conservative | |||
| 2007 | 35 | 10 | 3 | 0 | Conservative | |||
| New ward boundaries (48 seats)[9][10] | ||||||||
| 2008 | 40 | 5 | 3 | 0 | Conservative | |||
| 2010 | 40 | 5 | 3 | 0 | Conservative | |||
| 2011 | 37 | 9 | 2 | 0 | Conservative | |||
| 2012 | 34 | 11 | 2 | 1 | Conservative | |||
| 2014 | 31 | 14 | 2 | 1 | Conservative | |||
| 2015 | 31 | 14 | 2 | 1 | Conservative | |||
| New ward boundaries (48 seats)[1] | ||||||||
| 2016 | 28 | 15 | 5 | 0 | Conservative | |||
| 2018 | 28 | 15 | 8 | 0 | Conservative | |||
| 2019 | 23 | 13 | 12 | 0 | No overall control | |||
| 2021 | 28 | 9 | 11 | 0 | Conservative | |||
| 2022 | 26 | 10 | 12 | 0 | Conservative | |||
| 2023 | 22 | 12 | 14 | 0 | No overall control | |||
| 2024 | 12 | 20 | 16 | 0 | No overall control | |||
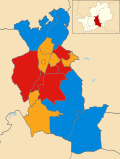
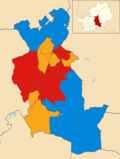
Results maps
-
 2002 results map
 -
 2003 results map
 -
 2004 results map
 -
 2006 results map
 -
 2007 results map
 -
 2008 results map
 -
 2010 results map
 -
 2011 results map
 -
 2012 results map
 -
 2014 results map
 -
 2015 results map
 -
 2016 results map
 -
 2018 results map
 -
 2019 results map
 -
 2021 results map
 -
 2022 results map
 -
 2023 results map
 -
 2024 results map


By-election results
1994–1998
| Party | Candidate | Votes | % | ±% | |
|---|---|---|---|---|---|
| Conservative | 486 | 49.5 | +10.4 | ||
| Labour | 292 | 29.8 | −22.4 | ||
| Liberal Democrats | 109 | 11.1 | +2.4 | ||
| No to Sleaze, No to Slough | 94 | 9.6 | +9.6 | ||
| Majority | 194 | 19.7 | |||
| Turnout | 981 | 25.0 | |||
| Conservative gain from Labour | Swing | ||||
| Party | Candidate | Votes | % | ±% | |
|---|---|---|---|---|---|
| Conservative | 517 | 42.9 | +21.0 | ||
| Labour | 454 | 37.7 | −28.2 | ||
| Liberal Democrats | 156 | 13.0 | +0.7 | ||
| Other | 77 | 6.4 | +6.4 | ||
| Majority | 63 | 5.2 | |||
| Turnout | 1,204 | ||||
| Conservative gain from Labour | Swing | ||||
1998–2002
| Party | Candidate | Votes | % | ±% | |
|---|---|---|---|---|---|
| Labour | 726 | 75.0 | +8.3 | ||
| Conservative | 241 | 24.9 | +4.7 | ||
| Majority | 485 | 50.1 | |||
| Turnout | 967 | 23.0 | |||
| Labour hold | Swing | ||||
| Party | Candidate | Votes | % | ±% | |
|---|---|---|---|---|---|
| Labour | 528 | 83.7 | +15.4 | ||
| Conservative | 103 | 16.3 | −1.2 | ||
| Majority | 425 | 67.4 | |||
| Turnout | 631 | 13.0 | |||
| Labour hold | Swing | ||||
| Party | Candidate | Votes | % | ±% | |
|---|---|---|---|---|---|
| Labour | 802 | ||||
| Labour | 797 | ||||
| Labour | 772 | ||||
| Conservative | 282 | ||||
| Conservative | 282 | ||||
| Conservative | 272 | ||||
| Liberal Democrats | 82 | ||||
| Liberal Democrats | 81 | ||||
| Liberal Democrats | 69 | ||||
| Turnout | 3,439 | 29.0 | |||
| Labour hold | Swing | ||||
| Labour hold | Swing | ||||
| Labour hold | Swing | ||||
| Party | Candidate | Votes | % | ±% | |
|---|---|---|---|---|---|
| Conservative | 831 | 51.6 | |||
| Labour | 381 | 23.7 | |||
| Liberal Democrats | 276 | 17.2 | |||
| UKIP | 121 | 7.5 | |||
| Majority | 450 | 27.9 | |||
| Turnout | 1,609 | 30.1 | |||
| Conservative hold | Swing | ||||
| Party | Candidate | Votes | % | ±% | |
|---|---|---|---|---|---|
| Labour | 611 | 58.8 | +1.7 | ||
| Conservative | 363 | 34.9 | +4.4 | ||
| Liberal Democrats | 65 | 6.3 | −6.2 | ||
| Majority | 248 | 23.9 | |||
| Turnout | 1,039 | 22.7 | |||
| Labour hold | Swing | ||||
2002–2006
| Party | Candidate | Votes | % | ±% | |
|---|---|---|---|---|---|
| Conservative | Howard Morgan | 539 | 50.7 | +7.9 | |
| Labour | 398 | 37.4 | −4.9 | ||
| Liberal Democrats | 126 | 11.9 | −3.0 | ||
| Majority | 141 | 13.3 | |||
| Turnout | 1,063 | 24.7 | |||
| Conservative gain from Labour | Swing | ||||
| Party | Candidate | Votes | % | ±% | |
|---|---|---|---|---|---|
| Conservative | Clare Berry | 484 | 46.8 | −3.9 | |
| Labour | Stuart Jackson | 444 | 42.9 | +5.5 | |
| Liberal Democrats | Mike Larkins | 106 | 10.3 | −1.6 | |
| Majority | 40 | 3.9 | |||
| Turnout | 1,034 | 23.8 | |||
| Conservative hold | Swing | ||||
| Party | Candidate | Votes | % | ±% | |
|---|---|---|---|---|---|
| Conservative | Christine Wheeler | 689 | 46.0 | +0.4 | |
| Labour | Christopher Cory | 521 | 34.8 | −5.1 | |
| Liberal Democrats | Ian Skidmore | 288 | 19.2 | +4.8 | |
| Majority | 168 | 11.2 | |||
| Turnout | 1,498 | 34.6 | |||
| Conservative hold | Swing | ||||
| Party | Candidate | Votes | % | ±% | |
|---|---|---|---|---|---|
| Labour | Samuel Smith | 546 | 38.2 | −0.2 | |
| Conservative | Sara Johnston | 456 | 32.0 | −2.8 | |
| Liberal Democrats | Eirwen Smith | 425 | 29.8 | +3.0 | |
| Majority | 90 | 6.2 | |||
| Turnout | 1,427 | 32.8 | |||
| Labour hold | Swing | ||||
| Party | Candidate | Votes | % | ±% | |
|---|---|---|---|---|---|
| Liberal Democrats | Anthony Skottowe | 1,124 | 56.5 | +11.0 | |
| Conservative | Lance Stanbury | 702 | 35.2 | −8.4 | |
| Labour | Sarah Carthew | 165 | 8.3 | −2.6 | |
| Majority | 422 | 21.3 | |||
| Turnout | 1,498 | 40.1 | |||
| Liberal Democrats hold | Swing | ||||
2006–2010
| Party | Candidate | Votes | % | ±% | |
|---|---|---|---|---|---|
| Conservative | Doug Berry | 539 | 40.7 | ||
| Liberal Democrats | John Elvy | 484 | 36.5 | ||
| BNP | Mark Fuller | 214 | 16.2 | ||
| Labour | Bridgit Croft | 88 | 6.6 | ||
| Majority | 55 | 4.2 | |||
| Turnout | 1,325 | 46.6 | |||
| Conservative hold | Swing | ||||
| Party | Candidate | Votes | % | ±% | |
|---|---|---|---|---|---|
| Labour | Maureen Cook | 425 | 33.2 | −8.3 | |
| Liberal Democrats | Hazel Laming | 329 | 25.7 | +10.5 | |
| Conservative | Stan Laver-Walton | 319 | 24.9 | −18.4 | |
| BNP | Mark Fuller | 138 | 10.8 | +10.8 | |
| Independent | Timothy Butler | 69 | 5.4 | +5.4 | |
| Majority | 96 | 7.5 | |||
| Turnout | 1,280 | 28.5 | |||
| Labour gain from Conservative | Swing | ||||
| Party | Candidate | Votes | % | ±% | |
|---|---|---|---|---|---|
| Conservative | Tony Kingsbury | 954 | 50.1 | −6.2 | |
| Liberal Democrats | Hazel Laming | 579 | 30.4 | +9.4 | |
| Labour | Cathy Watson | 370 | 19.4 | −3.2 | |
| Majority | 375 | 19.7 | |||
| Turnout | 1,903 | 40.4 | |||
| Conservative hold | Swing | ||||
| Party | Candidate | Votes | % | ±% | |
|---|---|---|---|---|---|
| Labour | Kieran Thorpe | 431 | 38.0 | ||
| Conservative | Sarah Langley | 413 | 36.4 | ||
| Liberal Democrats | Simon Archer | 291 | 25.6 | ||
| Majority | 18 | 1.6 | |||
| Turnout | 1,135 | 32.2 | |||
| Labour hold | Swing | ||||
2010–2014
| Party | Candidate | Votes | % | ±% | |
|---|---|---|---|---|---|
| Labour | Tony Crump | 580 | 39.1 | −10.8 | |
| Conservative | Madeleine Sawle | 458 | 30.8 | −4.2 | |
| UKIP | Kevin Daley | 277 | 18.7 | +18.7 | |
| Green | Susan Groom | 104 | 7.0 | −2.5 | |
| Liberal Democrats | Frank Marsh | 66 | 4.4 | −1.2 | |
| Majority | 122 | 8.2 | |||
| Turnout | 1,485 | ||||
| Labour hold | Swing | ||||
2014–2018
| Party | Candidate | Votes | % | ±% | |
|---|---|---|---|---|---|
| Conservative | Nathaniel Chapman | 502 | 34.1 | −1.3 | |
| Labour | Astrid Thorpe | 454 | 30.8 | −6.9 | |
| Liberal Democrats | Anthony Dennis | 437 | 29.6 | +17.7 | |
| Green | Lynne Allison | 81 | 5.5 | −9.5 | |
| Majority | 48 | 3.3 | |||
| Turnout | 1,474 | ||||
| Conservative hold | Swing | ||||
| Party | Candidate | Votes | % | ±% | |
|---|---|---|---|---|---|
| Conservative | Terry Mitchinson | 643 | 38.3 | −7.5 | |
| Liberal Democrats | Ayesha Rohale | 620 | 36.9 | +21.4 | |
| Labour | Lucy Musk | 418 | 24.9 | +2.6 | |
| Majority | 23 | 1.4 | |||
| Turnout | 1,681 | ||||
| Conservative hold | Swing | ||||
| Party | Candidate | Votes | % | ±% | |
|---|---|---|---|---|---|
| Labour | Tara-Mary Lyons | 1,359 | 40.1 | +2.2 | |
| Conservative | Peter Hebden | 1,352 | 39.9 | −10.0 | |
| Liberal Democrats | Jane Quinton | 677 | 20.0 | +7.8 | |
| Majority | 7 | 0.2 | |||
| Turnout | 3,388 | ||||
| Labour gain from Conservative | Swing | ||||
| Party | Candidate | Votes | % | ±% | |
|---|---|---|---|---|---|
| Liberal Democrats | Siobhan Elam | 1105 | 52.4 | +16.7 | |
| Conservative | Drew Richardson | 691 | 32.8 | −9.3 | |
| Labour | Belinda Yeldon | 260 | 12.3 | −3.5 | |
| Majority | 375 | 19.7 | |||
| Turnout | 2,111 | 38.5 | |||
| Liberal Democrats hold | Swing | ||||
2018–2022
| Party | Candidate | Votes | % | ±% | |
|---|---|---|---|---|---|
| Labour | Kieran Thorpe | 599 | 53.7 | +0.9 | |
| Conservative | Mark Smith | 273 | 24.5 | −8.9 | |
| Liberal Democrats | Richard Griffiths | 183 | 16.4 | +2.6 | |
| Abolish the TV Licence Party | Melvyn Jones | 61 | 5.5 | +5.5 | |
| Majority | 326 | 29.2 | |||
| Turnout | 1,116 | ||||
| Labour hold | Swing | ||||
2022–2026
Held alongside the 2025 Hertfordshire County Council election.
| Party | Candidate | Votes | % | ±% | |
|---|---|---|---|---|---|
| Conservative | Fiona Thomson | 813 | 45.9 | –13.0 | |
| Reform | Michael Southwell | 521 | 29.4 | +22.6 | |
| Labour | Graham Beevers | 223 | 12.6 | –8.7 | |
| Liberal Democrats | Anthony Green | 134 | 7.6 | –0.2 | |
| Green | William Berrington | 82 | 4.6 | –0.6 | |
| Majority | 292 | 16.5 | –21.1 | ||
| Turnout | 1,773 | 36.6 | +1.0 | ||
| Registered electors | 5,028 | ||||
| Conservative hold | |||||
| Party | Candidate | Votes | % | ±% | |
|---|---|---|---|---|---|
| Liberal Democrats | Fauzia Haider | 420 | 34.2 | –9.1 | |
| Reform | Mark Biddle | 375 | 30.5 | New | |
| Labour | Sarah Ellingworth | 243 | 19.8 | –16.5 | |
| Conservative | Jeet Dhelaria | 98 | 8.0 | –4.2 | |
| Green | Tanya Dickson | 91 | 7.4 | –0.8 | |
| Majority | 45 | 3.7 | –3.3 | ||
| Turnout | 1,227 | 31.3 | +5.2 | ||
| Registered electors | 5,580 | ||||
| Liberal Democrats hold | |||||
References
- ^ Includes totals for the predecessors of the Liberal Democrats, the Liberal Party and SDP (both of which participated in the Alliance).
- ^ Including 3 vacant seats
- ^ a b "The Welwyn Hatfield (Electoral Changes) Order 2016", legislation.gov.uk, The National Archives, SI 2016/116, retrieved 12 May 2023
- ^ "Composition calculator". Colin Rallings & Michael Thrasher. The Elections Centre, Plymouth University. Retrieved 14 May 2025.
- ^ The District of Welwyn Hatfield (Electoral Arrangements) Order 1976
- ^ The East Hertfordshire and Welwyn Hatfield (Areas) Order 1985
- ^ legislation.gov.uk - The District of Welwyn Hatfield (Electoral Arrangements) Order 1991. Retrieved on 4 November 2015.
- ^ legislation.gov.uk - The Essex, Greater London and Hertfordshire (County and London Borough Boundaries) Order 1993. Retrieved on 5 November 2015.
- ^ "Welwyn Hatfield". BBC News Online. Retrieved 3 March 2010.
- ^ legislation.gov.uk - The District of Welwyn Hatfield (Electoral Changes) Order 1998. Retrieved on 4 October 2015.
- ^ "Welwyn Hatfield". BBC News Online. 19 April 2008. Retrieved 3 March 2010.
- ^ legislation.gov.uk - The Borough of Welwyn Hatfield (Electoral Changes) Order 2008. Retrieved on 3 November 2015.
- ^ "Tories inch ahead". guardian.co.uk. London. 9 November 2001. Retrieved 3 March 2010.
- ^ "Labour loses three seats in council by-elections". St Albans & Harpenden Review. 25 June 2003. Retrieved 7 March 2010.
- ^ a b "Small byelection gain for Lib Dems". guardian.co.uk. London. 28 November 2003. Retrieved 3 March 2010.
- ^ "By Election Results - 30 June 2005". Welwyn Hatfield Borough Council. Retrieved 3 March 2010.
- ^ "By Election Results - 26 June 2008". Welwyn Hatfield Borough Council. Retrieved 3 March 2010.
- ^ a b "By Election Results - 4 June 2009". Welwyn Hatfield Borough Council. Retrieved 3 March 2010.
- ^ "Local Elections Archive Project — Haldens Ward". www.andrewteale.me.uk. Retrieved 13 June 2024.
- ^ "Local Elections Archive Project — Haldens Ward". www.andrewteale.me.uk. Retrieved 13 June 2024.
- ^ "Local Elections Archive Project — Panshanger Ward". www.andrewteale.me.uk. Retrieved 13 June 2024.
- ^ "Local Elections Archive Project — Hatfield Villages Ward". www.andrewteale.me.uk. Retrieved 13 June 2024.
- ^ "Local Elections Archive Project — Handside Ward". www.andrewteale.me.uk. Retrieved 13 June 2024.
- ^ "Local Elections Archive Project — Hatfield Central Ward". www.andrewteale.me.uk. Retrieved 13 June 2024.
- ^ Ng, Ka (2 May 2025). "Declaration of Result of Poll - Brookmans Park and Little Heath Ward" (PDF). Welwyn Hatfield Borough Council. Retrieved 14 May 2025.
- ^ Ng, Ka (2 May 2025). "Declaration of Result of Poll - Peartree Ward" (PDF). Welwyn Hatfield Borough Council. Retrieved 14 May 2025.
- By-election results Archived 29 March 2010 at the Wayback Machine