


Sedgwick County, Colorado
Sedgwick County, Colorado | |
|---|---|
 Sedgwick County Courthouse, Julesburg | |
 Location within the U.S. state of Colorado | |
| Coordinates: 40°53′N 102°21′W / 40.88°N 102.35°W | |
| Country | |
| State | |
| Founded | April 9, 1889 |
| Named after | John Sedgwick |
| Seat | Julesburg |
| Largest town | Julesburg |
| Area | |
• Total | 549 sq mi (1,420 km2) |
| • Land | 548 sq mi (1,420 km2) |
| • Water | 1.4 sq mi (3.6 km2) 0.2% |
| Population (2020) | |
• Total | 2,404 |
• Estimate (2024) | 2,257 |
| • Density | 4.39/sq mi (1.69/km2) |
| Time zone | UTC−7 (Mountain) |
| • Summer (DST) | UTC−6 (MDT) |
| Congressional district | 4th |
| Website | sedgwickcounty |
Sedgwick County is a county located in the U.S. state of Colorado. As of the 2020 census, the population was 2,404.[1] The county seat is Julesburg.[2] The county was named for Fort Sedgwick, a military post along the Platte Trail, which was named for General John Sedgwick. It is located at the state border with Nebraska.
History
Sedgwick County was named after John Sedgwick, who was a major general in the Union Army during the American Civil War.
Geography
According to the U.S. Census Bureau, the county has a total area of 549 square miles (1,420 km2), of which 548 square miles (1,420 km2) is land and 1.4 square miles (3.6 km2) (0.2%) is water.[3]
Adjacent counties
- Deuel County, Nebraska – north
- Perkins County, Nebraska – east
- Phillips County – south
- Logan County – west
- Cheyenne County, Nebraska – northwest
Major highways
Trails and byways
- American Discovery Trail
- First transcontinental railroad
- Pony Express National Historic Trail
- South Platte River Trail Scenic and Historic Byway
- South Platte Trail
Upper Crossing of the California Trail
Demographics
| Census | Pop. | Note | %± |
|---|---|---|---|
| 1890 | 1,293 | — | |
| 1900 | 971 | −24.9% | |
| 1910 | 3,061 | 215.2% | |
| 1920 | 4,207 | 37.4% | |
| 1930 | 5,580 | 32.6% | |
| 1940 | 5,294 | −5.1% | |
| 1950 | 5,095 | −3.8% | |
| 1960 | 4,242 | −16.7% | |
| 1970 | 3,405 | −19.7% | |
| 1980 | 3,266 | −4.1% | |
| 1990 | 2,690 | −17.6% | |
| 2000 | 2,747 | 2.1% | |
| 2010 | 2,379 | −13.4% | |
| 2020 | 2,404 | 1.1% | |
| 2024 (est.) | 2,257 | [4] | −6.1% |
| U.S. Decennial Census[5] 1790-1960[6] 1900–1990[7] 1990-2000[8] 2010–2020[1] | |||
2020 census
As of the 2020 census, the county had a population of 2,404. Of the residents, 20.1% were under the age of 18 and 27.6% were 65 years of age or older; the median age was 49.6 years. For every 100 females there were 100.7 males, and for every 100 females age 18 and over there were 101.5 males. 0.0% of residents lived in urban areas and 100.0% lived in rural areas.[9][10][11]
| Race / Ethnicity (NH = Non-Hispanic) | Pop 2000[12] | Pop 2010[13] | Pop 2020[14] | % 2000 | % 2010 | % 2020 |
|---|---|---|---|---|---|---|
| White alone (NH) | 2,376 | 2,036 | 1,934 | 86.49% | 85.58% | 80.45% |
| Black or African American alone (NH) | 9 | 7 | 3 | 0.33% | 0.29% | 0.12% |
| Native American or Alaska Native alone (NH) | 3 | 8 | 10 | 0.11% | 0.34% | 0.42% |
| Asian alone (NH) | 19 | 17 | 12 | 0.69% | 0.71% | 0.50% |
| Pacific Islander alone (NH) | 2 | 0 | 0 | 0.07% | 0.00% | 0.00% |
| Other race alone (NH) | 0 | 1 | 8 | 0.00% | 0.04% | 0.33% |
| Mixed race or Multiracial (NH) | 24 | 21 | 74 | 0.87% | 0.88% | 3.08% |
| Hispanic or Latino (any race) | 314 | 289 | 363 | 11.43% | 12.15% | 15.10% |
| Total | 2,747 | 2,379 | 2,404 | 100.00% | 100.00% | 100.00% |
The racial makeup of the county was 85.8% White, 0.2% Black or African American, 0.8% American Indian and Alaska Native, 0.5% Asian, 0.0% Native Hawaiian and Pacific Islander, 5.0% from some other race, and 7.7% from two or more races. Hispanic or Latino residents of any race comprised 15.1% of the population.[11]
There were 1,086 households in the county, of which 24.0% had children under the age of 18 living with them and 24.4% had a female householder with no spouse or partner present. About 32.6% of all households were made up of individuals and 16.7% had someone living alone who was 65 years of age or older.[10]
There were 1,343 housing units, of which 19.1% were vacant. Among occupied housing units, 68.9% were owner-occupied and 31.1% were renter-occupied. The homeowner vacancy rate was 1.8% and the rental vacancy rate was 9.8%.[10]
2000 census
At the 2000 census there were 2,747 people in 1,165 households, including 802 families, in the county. The population density was 5 people per square mile (1.9 people/km2). There were 1,387 housing units at an average density of 2 units per square mile (0.77 units/km2). The racial makeup of the county was 90.50% White, 0.51% Black or African American, 0.15% Native American, 0.76% Asian, 0.07% Pacific Islander, 5.97% from other races, and 2.04% from two or more races. 11.43% of the population were Hispanic or Latino of any race.[15] Of the 1,165 households 26.40% had children under the age of 18 living with them, 59.10% were married couples living together, 6.60% had a female householder with no husband present, and 31.10% were non-families. 29.40% of households were one person and 13.60% were one person aged 65 or older. The average household size was 2.31 and the average family size was 2.83.
The age distribution was 22.80% under the age of 18, 6.60% from 18 to 24, 23.50% from 25 to 44, 25.00% from 45 to 64, and 22.10% 65 or older. The median age was 43 years. For every 100 females there were 100.10 males. For every 100 females age 18 and over, there were 97.20 males.
The median household income was $28,278 and the median family income was $33,953. Males had a median income of $25,463 versus $16,392 for females. The per capita income for the county was $16,125. About 7.80% of families and 10.00% of the population were below the poverty line, including 13.70% of those under age 18 and 4.20% of those age 65 or over.
Politics
Sedgwick County has been strongly Republican for most of its history. It was the only Colorado county to vote for Charles Evans Hughes in 1916 and one of only two carried by Theodore Roosevelt in 1912, while only three Democratic presidential candidates – William Jennings Bryan in the “free silver” 1896 election plus Franklin D. Roosevelt and Lyndon Johnson in the 1932, 1936 and 1964 landslide wins – have ever carried the county, which has voted for the same candidate as the state of South Dakota in every election since its formation.
| Year | Republican | Democratic | Third party(ies) | |||
|---|---|---|---|---|---|---|
| No. | % | No. | % | No. | % | |
| 1892 | 198 | 35.29% | 0 | 0.00% | 363 | 64.71% |
| 1896 | 130 | 36.62% | 216 | 60.85% | 9 | 2.54% |
| 1900 | 256 | 58.18% | 163 | 37.05% | 21 | 4.77% |
| 1904 | 347 | 69.82% | 131 | 26.36% | 19 | 3.82% |
| 1908 | 544 | 64.30% | 278 | 32.86% | 24 | 2.84% |
| 1912 | 328 | 29.68% | 338 | 30.59% | 439 | 39.73% |
| 1916 | 529 | 46.86% | 519 | 45.97% | 81 | 7.17% |
| 1920 | 819 | 65.31% | 372 | 29.67% | 63 | 5.02% |
| 1924 | 779 | 51.97% | 372 | 24.82% | 348 | 23.22% |
| 1928 | 1,247 | 67.51% | 580 | 31.40% | 20 | 1.08% |
| 1932 | 884 | 39.10% | 1,288 | 56.97% | 89 | 3.94% |
| 1936 | 977 | 40.57% | 1,358 | 56.40% | 73 | 3.03% |
| 1940 | 1,448 | 59.86% | 959 | 39.64% | 12 | 0.50% |
| 1944 | 1,228 | 68.26% | 568 | 31.57% | 3 | 0.17% |
| 1948 | 1,020 | 54.63% | 834 | 44.67% | 13 | 0.70% |
| 1952 | 1,528 | 68.74% | 686 | 30.86% | 9 | 0.40% |
| 1956 | 1,334 | 63.55% | 760 | 36.21% | 5 | 0.24% |
| 1960 | 1,230 | 61.41% | 769 | 38.39% | 4 | 0.20% |
| 1964 | 895 | 48.67% | 942 | 51.22% | 2 | 0.11% |
| 1968 | 1,007 | 60.92% | 546 | 33.03% | 100 | 6.05% |
| 1972 | 1,129 | 67.85% | 485 | 29.15% | 50 | 3.00% |
| 1976 | 902 | 53.06% | 773 | 45.47% | 25 | 1.47% |
| 1980 | 1,151 | 67.39% | 438 | 25.64% | 119 | 6.97% |
| 1984 | 1,146 | 72.39% | 429 | 27.10% | 8 | 0.51% |
| 1988 | 921 | 59.61% | 611 | 39.55% | 13 | 0.84% |
| 1992 | 447 | 39.01% | 397 | 34.64% | 302 | 26.35% |
| 1996 | 715 | 52.69% | 519 | 38.25% | 123 | 9.06% |
| 2000 | 877 | 67.31% | 384 | 29.47% | 42 | 3.22% |
| 2004 | 971 | 71.40% | 374 | 27.50% | 15 | 1.10% |
| 2008 | 857 | 63.43% | 468 | 34.64% | 26 | 1.92% |
| 2012 | 881 | 65.84% | 419 | 31.32% | 38 | 2.84% |
| 2016 | 1,015 | 74.41% | 267 | 19.57% | 82 | 6.01% |
| 2020 | 1,121 | 77.52% | 301 | 20.82% | 24 | 1.66% |
| 2024 | 1,048 | 77.17% | 283 | 20.84% | 27 | 1.99% |
Communities
Towns
See also
- Bibliography of Colorado
- Geography of Colorado
- History of Colorado
- Index of Colorado-related articles
- List of Colorado-related lists
- Outline of Colorado
Notes
References
- ^ a b "State & County QuickFacts". United States Census Bureau. Retrieved September 5, 2021.
- ^ "Find a County". National Association of Counties. Retrieved June 7, 2011.
- ^ "US Gazetteer files: 2010, 2000, and 1990". United States Census Bureau. February 12, 2011. Retrieved April 23, 2011.
- ^ "County Population Totals and Components of Change: 2020-2024". United States Census Bureau. Retrieved June 3, 2025.
- ^ "U.S. Decennial Census". United States Census Bureau. Retrieved June 11, 2014.
- ^ "Historical Census Browser". University of Virginia Library. Retrieved June 11, 2014.
- ^ "Population of Counties by Decennial Census: 1900 to 1990". United States Census Bureau. Retrieved June 11, 2014.
- ^ "Census 2000 PHC-T-4. Ranking Tables for Counties: 1990 and 2000" (PDF). United States Census Bureau. Archived (PDF) from the original on March 27, 2010. Retrieved June 11, 2014.
- ^ "2020 Decennial Census Demographic and Housing Characteristics (DHC)". United States Census Bureau. 2023. Retrieved 2025-12-08.
- ^ a b c "2020 Decennial Census Demographic Profile (DP1)". United States Census Bureau. 2021. Retrieved 2025-12-08.
- ^ a b "2020 Decennial Census Redistricting Data (Public Law 94-171)". United States Census Bureau. 2021. Retrieved 2025-12-08.
- ^ "P004: Hispanic or Latino, and Not Hispanic or Latino by Race – 2000: DEC Summary File 1 – Sedgwick County, Colorado". United States Census Bureau. Retrieved February 7, 2026.
- ^ "P2 Hispanic or Latino, and Not Hispanic or Latino by Race – 2010: DEC Redistricting Data (PL 94-171) - Sedgwick County, Colorado". United States Census Bureau. Retrieved February 7, 2026.
- ^ "P2 Hispanic or Latino, and Not Hispanic or Latino by Race – 2020: DEC Redistricting Data (PL 94-171) - Sedgwick County, Colorado". United States Census Bureau. Retrieved February 7, 2026.
- ^ "U.S. Census website". United States Census Bureau. Retrieved May 14, 2011.
- ^ Leip, David. "Dave Leip's Atlas of U.S. Presidential Elections". uselectionatlas.org. Retrieved May 26, 2017.
External links
Municipalities and communities of Sedgwick County, Colorado, United States | ||
|---|---|---|
| Towns | 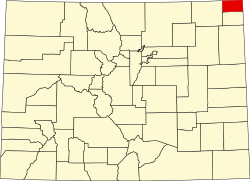 | |
Places adjacent to Sedgwick County, Colorado | ||||||||||||||||
|---|---|---|---|---|---|---|---|---|---|---|---|---|---|---|---|---|
| ||||||||||||||||
| International | |
|---|---|
| National | |
| Other | |