


Las Animas County, Colorado
Las Animas County, Colorado | |
|---|---|
County | |
 Las Animas County Courthouse in Trinidad | |
 Location within the U.S. state of Colorado | |
| Coordinates: 37°19′N 104°02′W / 37.32°N 104.04°W | |
| Country | |
| State | |
| Founded | February 9, 1866 |
| Named after | Purgatoire River |
| Seat | Trinidad |
| Area | |
• Total | 4,775 sq mi (12,370 km2) |
| • Land | 4,773 sq mi (12,360 km2) |
| • Water | 2.7 sq mi (7.0 km2) 0.06% |
| Population (2020) | |
• Total | 14,555 |
• Estimate (2024) | 14,518 |
| • Density | 3.049/sq mi (1.177/km2) |
| Time zone | UTC−7 (Mountain) |
| • Summer (DST) | UTC−6 (MDT) |
| Area code | 719 |
| Website | lasanimascounty |
- Not to be confused with the City of Las Animas, Colorado

Las Animas County is a county located in the U.S. state of Colorado. As of the 2020 census, the population was 14,555.[1] The county seat is Trinidad.[2] The county takes its name from the Mexican Spanish name of the Purgatoire River, originally called El Río de las Ánimas Perdidas en el Purgatorio, which means "River of the Lost Souls in Purgatory."[3]
Geography
According to the U.S. Census Bureau, the county has a total area of 4,775 square miles (12,370 km2), of which 4,773 square miles (12,360 km2) is land and 2.7 square miles (7.0 km2) (0.06%) is water.[4] It is the largest county by area in Colorado.
Adjacent counties
- Otero County - north
- Pueblo County - north
- Bent County - northeast
- Baca County - east
- Union County, New Mexico - south
- Colfax County, New Mexico - southwest
- Costilla County- west
- Huerfano County - northwest
Major highways
Protected areas
- Comanche National Grassland
- Lake Dorothey State Wildlife Area
- James M. John State Wildlife Area
- San Isabel National Forest
- Spanish Peaks Wilderness
- Fishers Peak State Park
- Trinidad Lake State Park
Historic trails and landmarks
- Mesa de Maya
- Raton Pass National Historic Landmark
- Santa Fe National Historic Trail
- Trinidad State History Museum
Scenic byways
Demographics
| Census | Pop. | Note | %± |
|---|---|---|---|
| 1870 | 4,276 | — | |
| 1880 | 8,903 | 108.2% | |
| 1890 | 17,208 | 93.3% | |
| 1900 | 21,842 | 26.9% | |
| 1910 | 33,643 | 54.0% | |
| 1920 | 38,975 | 15.8% | |
| 1930 | 36,008 | −7.6% | |
| 1940 | 32,369 | −10.1% | |
| 1950 | 25,902 | −20.0% | |
| 1960 | 19,983 | −22.9% | |
| 1970 | 15,744 | −21.2% | |
| 1980 | 14,897 | −5.4% | |
| 1990 | 13,765 | −7.6% | |
| 2000 | 15,207 | 10.5% | |
| 2010 | 15,507 | 2.0% | |
| 2020 | 14,555 | −6.1% | |
| 2024 (est.) | 14,518 | [5] | −0.3% |
| U.S. Decennial Census[6] 1790-1960[7] 1900-1990[8] 1990-2000[9] 2010-2020[1] | |||
2020 census
As of the 2020 census, the county had a population of 14,555. Of the residents, 17.3% were under the age of 18 and 25.7% were 65 years of age or older; the median age was 48.4 years. For every 100 females there were 109.2 males, and for every 100 females age 18 and over there were 110.2 males. 57.2% of residents lived in urban areas and 42.8% lived in rural areas.[10][11][12]
| Race / Ethnicity (NH = Non-Hispanic) | Pop 2000[13] | Pop 2010[14] | Pop 2020[15] | % 2000 | % 2010 | % 2020 |
|---|---|---|---|---|---|---|
| White alone (NH) | 8,387 | 8,399 | 7,965 | 55.15% | 54.16% | 54.72% |
| Black or African American alone (NH) | 52 | 195 | 183 | 0.34% | 1.26% | 1.26% |
| Native American or Alaska Native alone (NH) | 161 | 170 | 145 | 1.06% | 1.10% | 1.00% |
| Asian alone (NH) | 53 | 98 | 108 | 0.35% | 0.63% | 0.74% |
| Pacific Islander alone (NH) | 13 | 4 | 12 | 0.09% | 0.03% | 0.08% |
| Other race alone (NH) | 16 | 12 | 87 | 0.11% | 0.08% | 0.60% |
| Mixed race or Multiracial (NH) | 221 | 183 | 423 | 1.45% | 1.18% | 2.91% |
| Hispanic or Latino (any race) | 6,304 | 6,446 | 5,632 | 41.45% | 41.57% | 38.69% |
| Total | 15,207 | 15,507 | 14,555 | 100.00% | 100.00% | 100.00% |
The racial makeup of the county was 68.9% White, 1.4% Black or African American, 2.5% American Indian and Alaska Native, 0.8% Asian, 0.1% Native Hawaiian and Pacific Islander, 11.0% from some other race, and 15.1% from two or more races. Hispanic or Latino residents of any race comprised 38.7% of the population.[12]
There were 6,373 households in the county, of which 22.0% had children under the age of 18 living with them and 27.1% had a female householder with no spouse or partner present. About 35.6% of all households were made up of individuals and 18.1% had someone living alone who was 65 years of age or older.[11]
There were 8,077 housing units, of which 21.1% were vacant. Among occupied housing units, 69.7% were owner-occupied and 30.3% were renter-occupied. The homeowner vacancy rate was 2.9% and the rental vacancy rate was 12.2%.[11]
2000 census
At the 2000 census there were 15,207 people, 6,173 households, and 4,092 families living in the county. The population density was 3 people per square mile (1.2 people/km2). There were 7,629 housing units at an average density of 2 units per square mile (0.77 units/km2). The racial makeup of the county was 82.63% White, 0.39% Black or African American, 2.54% Native American, 0.37% Asian, 0.20% Pacific Islander, 10.03% from other races, and 3.83% from two or more races. 41.45% of the population were Hispanic or Latino of any race.[16] Of the 6,173 households 28.80% had children under the age of 18 living with them, 49.90% were married couples living together, 11.60% had a female householder with no husband present, and 33.70% were non-families. 29.70% of households were one person and 14.30% were one person aged 65 or older. The average household size was 2.40 and the average family size was 2.97.
The age distribution was 24.20% under the age of 18, 7.90% from 18 to 24, 24.00% from 25 to 44, 25.90% from 45 to 64, and 18.00% 65 or older. The median age was 41 years. For every 100 females there were 95.80 males. For every 100 females age 18 and over, there were 93.70 males.
The median household income was $28,273 and the median family income was $34,072. Males had a median income of $27,182 versus $20,891 for females. The per capita income for the county was $16,829. About 14.00% of families and 17.30% of the population were below the poverty line, including 20.00% of those under age 18 and 17.20% of those age 65 or over.
Politics
A Democratic stronghold since the days of Franklin Roosevelt after having been solidly Republican during the "system of 1896" like the rest of Hispanic Colorado, Las Animas County has seen a strong trend toward the Republican Party in recent elections. Hillary Clinton's 2016 performance was the worst by a Democrat since John W. Davis in 1924. She was also the first Democrat to lose the county since George McGovern in 1972. In 2020, Joe Biden became the first Democrat to win the presidency without the county since Woodrow Wilson in 1912.
Las Animas County was the only county in Colorado to vote for legal abortion but against legal same-sex marriage in 2024, although anti-LGBT sentiment was also noticeably higher than anti-abortion sentiment in neighboring Bent County as well as in Jackson County on the opposite side of the state, both of which opposed both but only opposed same-sex marriage by a landslide margin. In Colorado overall, the pro-LGBT Amendment J did slightly better than the pro-choice Amendment 79.[17]
| Year | Republican | Democratic | Third party(ies) | |||
|---|---|---|---|---|---|---|
| No. | % | No. | % | No. | % | |
| 1880 | 586 | 30.14% | 1,314 | 67.59% | 44 | 2.26% |
| 1884 | 1,039 | 41.73% | 1,451 | 58.27% | 0 | 0.00% |
| 1888 | 2,655 | 46.85% | 2,785 | 49.14% | 227 | 4.01% |
| 1892 | 1,276 | 41.31% | 0 | 0.00% | 1,813 | 58.69% |
| 1896 | 1,126 | 16.90% | 5,497 | 82.50% | 40 | 0.60% |
| 1900 | 3,382 | 44.16% | 4,204 | 54.90% | 72 | 0.94% |
| 1904 | 5,218 | 52.97% | 4,486 | 45.54% | 146 | 1.48% |
| 1908 | 5,716 | 56.39% | 4,212 | 41.55% | 209 | 2.06% |
| 1912 | 4,318 | 43.82% | 3,604 | 36.57% | 1,932 | 19.61% |
| 1916 | 3,511 | 38.81% | 5,300 | 58.58% | 236 | 2.61% |
| 1920 | 4,707 | 51.19% | 4,167 | 45.31% | 322 | 3.50% |
| 1924 | 5,698 | 48.68% | 2,758 | 23.56% | 3,250 | 27.76% |
| 1928 | 5,367 | 44.74% | 6,459 | 53.85% | 169 | 1.41% |
| 1932 | 3,651 | 28.35% | 8,964 | 69.61% | 262 | 2.03% |
| 1936 | 3,333 | 24.49% | 10,220 | 75.08% | 59 | 0.43% |
| 1940 | 4,859 | 35.53% | 8,766 | 64.10% | 50 | 0.37% |
| 1944 | 4,179 | 37.87% | 6,800 | 61.63% | 55 | 0.50% |
| 1948 | 3,452 | 30.79% | 7,586 | 67.67% | 172 | 1.53% |
| 1952 | 4,467 | 40.74% | 6,446 | 58.79% | 51 | 0.47% |
| 1956 | 5,290 | 50.80% | 5,099 | 48.96% | 25 | 0.24% |
| 1960 | 2,989 | 30.74% | 6,704 | 68.96% | 29 | 0.30% |
| 1964 | 1,833 | 21.68% | 6,591 | 77.97% | 29 | 0.34% |
| 1968 | 2,499 | 33.30% | 4,602 | 61.33% | 403 | 5.37% |
| 1972 | 3,659 | 52.59% | 3,222 | 46.31% | 76 | 1.09% |
| 1976 | 2,615 | 36.45% | 4,459 | 62.15% | 101 | 1.41% |
| 1980 | 2,917 | 39.37% | 4,117 | 55.57% | 375 | 5.06% |
| 1984 | 2,992 | 44.38% | 3,670 | 54.43% | 80 | 1.19% |
| 1988 | 2,162 | 34.15% | 4,075 | 64.37% | 94 | 1.48% |
| 1992 | 1,739 | 26.47% | 3,847 | 58.56% | 983 | 14.96% |
| 1996 | 1,905 | 31.53% | 3,611 | 59.76% | 526 | 8.71% |
| 2000 | 2,569 | 42.16% | 3,243 | 53.22% | 282 | 4.63% |
| 2004 | 3,196 | 48.48% | 3,300 | 50.06% | 96 | 1.46% |
| 2008 | 3,086 | 45.64% | 3,562 | 52.68% | 113 | 1.67% |
| 2012 | 3,263 | 47.55% | 3,445 | 50.20% | 154 | 2.24% |
| 2016 | 3,710 | 54.62% | 2,650 | 39.01% | 433 | 6.37% |
| 2020 | 4,284 | 53.81% | 3,497 | 43.93% | 180 | 2.26% |
| 2024 | 4,328 | 55.54% | 3,276 | 42.04% | 189 | 2.43% |
Communities
City
Towns
Unincorporated communities
Former towns
Census-designated places
Gallery
-
 Area affected by 1930s Dust Bowl
 -
 Public library in Trinidad serves Las Animas County
 -
 Santa Nina de Atoche church, Tijeras Plaza, Las Animas County, c.1934
 -
 Philatelic cover postmarked Officer, Colorado on the last day of service. Mail from this discontinued post office was then handled at Villegreen, Colorado, now also a discontinued post office.
.svg)


See also
- Bibliography of Colorado
- Geography of Colorado
- History of Colorado
- Index of Colorado-related articles
- List of Colorado-related lists
- Outline of Colorado
References
- ^ a b "State & County QuickFacts". United States Census Bureau. Retrieved September 5, 2021. Cite error: The named reference "2020Census" was defined multiple times with different content (see the help page).
- ^ "Find a County". National Association of Counties. Retrieved June 7, 2011.
- ^ Gannett, Henry (1905). The Origin of Certain Place Names in the United States. U.S. Government Printing Office. p. 182.
- ^ "US Gazetteer files: 2010, 2000, and 1990". United States Census Bureau. February 12, 2011. Retrieved April 23, 2011.
- ^ "County Population Totals and Components of Change: 2020-2024". United States Census Bureau. Retrieved June 3, 2025.
- ^ "U.S. Decennial Census". United States Census Bureau. Retrieved June 8, 2014.
- ^ "Historical Census Browser". University of Virginia Library. Retrieved June 8, 2014.
- ^ "Population of Counties by Decennial Census: 1900 to 1990". United States Census Bureau. Retrieved June 8, 2014.
- ^ "Census 2000 PHC-T-4. Ranking Tables for Counties: 1990 and 2000" (PDF). United States Census Bureau. Archived (PDF) from the original on March 27, 2010. Retrieved June 8, 2014.
- ^ "2020 Decennial Census Demographic and Housing Characteristics (DHC)". United States Census Bureau. 2023. Retrieved 2025-12-08.
- ^ a b c "2020 Decennial Census Demographic Profile (DP1)". United States Census Bureau. 2021. Retrieved 2025-12-08.
- ^ a b "2020 Decennial Census Redistricting Data (Public Law 94-171)". United States Census Bureau. 2021. Retrieved 2025-12-08.
- ^ "P004: Hispanic or Latino, and Not Hispanic or Latino by Race – 2000: DEC Summary File 1 – Las Animas County, Colorado". United States Census Bureau. Retrieved February 7, 2026.
- ^ "P2 Hispanic or Latino, and Not Hispanic or Latino by Race – 2010: DEC Redistricting Data (PL 94-171) - Las Animas County, Colorado". United States Census Bureau. Retrieved February 7, 2026.
- ^ "P2 Hispanic or Latino, and Not Hispanic or Latino by Race – 2020: DEC Redistricting Data (PL 94-171) - Las Animas County, Colorado". United States Census Bureau. Retrieved February 7, 2026.
- ^ "U.S. Census website". United States Census Bureau. Retrieved May 14, 2011.
- ^ "Election Night Reporting". results.enr.clarityelections.com.
- ^ Leip, David. "Dave Leip's Atlas of U.S. Presidential Elections". uselectionatlas.org. Retrieved May 26, 2017.
External links
Municipalities and communities of Las Animas County, Colorado, United States | ||
|---|---|---|
| City | 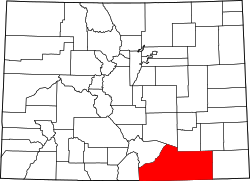 | |
| Towns | ||
| CDPs | ||
| Unincorporated communities | ||
| Ghost towns | ||
Places adjacent to Las Animas County, Colorado | ||||||||||||||||
|---|---|---|---|---|---|---|---|---|---|---|---|---|---|---|---|---|
| ||||||||||||||||
| International | |
|---|---|
| National | |
| Other | |