


Dunnavant, Alabama
Dunnavant, Alabama | |
|---|---|
 Location of Dunnavant in Shelby County, Alabama. | |
| Coordinates: 33°30′45″N 86°31′30″W / 33.51250°N 86.52500°W[1] | |
| Country | United States |
| State | Alabama |
| County | Shelby |
| Area | |
• Total | 20.27 sq mi (52.51 km2) |
| • Land | 19.25 sq mi (49.87 km2) |
| • Water | 1.02 sq mi (2.64 km2) |
| Elevation | 705 ft (215 m) |
| Population (2020) | |
• Total | 936 |
| • Density | 48.6/sq mi (18.77/km2) |
| Time zone | UTC-6 (Central (CST)) |
| • Summer (DST) | UTC-5 (CDT) |
| Area codes | 205, 659 |
| GNIS feature ID | 2582671[1] |
Dunnavant, also spelled Dunavant, is a census-designated place and unincorporated community in northern Shelby County, Alabama, United States. As of the 2020 census, Dunnavant had a population of 936.[3] The community's name is probably derived from a local family.[4] A post office was established in 1897 and was in operation until it was closed in 1958.[5]
Geography
Dunnavant is in central Alabama, in the southernmost extensions of the Appalachian Mountains along Alabama State Route 25 and Shelby County Road 41. Leeds is 6 mi (10 km) north, and the unincorporated community of Vandiver is 4 mi (6 km) southeast on a windy and mountainous route. Shelby County 41 leads southwest as Dunnavant Valley Rd 15 mi (24 km) to Chelsea.
Demographics
| Census | Pop. | Note | %± |
|---|---|---|---|
| 2010 | 981 | — | |
| 2020 | 936 | −4.6% | |
| U.S. Decennial Census[6] | |||
Dunnavant was first listed as a census designated place in the 2010 U.S. census.[7]
| Race / Ethnicity (NH = Non-Hispanic) | Pop 2010[8] | Pop 2020[9] | % 2010 | % 2020 |
|---|---|---|---|---|
| White alone (NH) | 936 | 849 | 95.41% | 90.71% |
| Black or African American alone (NH) | 4 | 14 | 0.41% | 1.50% |
| Native American or Alaska Native alone (NH) | 7 | 6 | 0.71% | 0.64% |
| Asian alone (NH) | 0 | 3 | 0.00% | 0.32% |
| Native Hawaiian or Pacific Islander alone (NH) | 0 | 0 | 0.00% | 0.00% |
| Other race alone (NH) | 0 | 2 | 0.00% | 0.21% |
| Mixed race or Multiracial (NH) | 11 | 32 | 1.12% | 3.42% |
| Hispanic or Latino (any race) | 23 | 30 | 2.34% | 3.21% |
| Total | 981 | 936 | 100.00% | 100.00% |
References
- ^ a b c U.S. Geological Survey Geographic Names Information System: Dunnavant, Alabama
- ^ "2020 U.S. Gazetteer Files". United States Census Bureau. Retrieved October 29, 2021.
- ^ "2020 Decennial Census Redistricting Data (Public Law 94-171)". United States Census Bureau. 2021. Retrieved March 6, 2026.
- ^ Foscue, Virginia (1989). Place Names in Alabama. Tuscaloosa: The University of Alabama Press. p. 102. ISBN 0-8173-0410-X.
- ^ "Shelby County". Jim Forte Postal History. Archived from the original on October 22, 2014. Retrieved October 21, 2014.
- ^ "Census of Population and Housing". Census.gov. Retrieved June 4, 2016.
- ^ "2010 Census of Population - Population and Housing Unit Counts - Alabama" (PDF). United States Census Bureau. 2010. Archived from the original (PDF) on January 21, 2022.
- ^ "P2: Hispanic or Latino, and Not Hispanic or Latino by Race – 2010: DEC Redistricting Data (PL 94-171) – Dunnavant CDP, Alabama". United States Census Bureau.
- ^ "P2: Hispanic or Latino, and Not Hispanic or Latino by Race – 2020: DEC Redistricting Data (PL 94-171) – Dunnavant CDP, Alabama". United States Census Bureau.
Municipalities and communities of Shelby County, Alabama, United States | ||
|---|---|---|
| Cities | 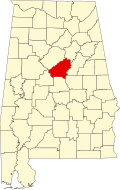 | |
| Towns | ||
| CDPs | ||
| Other unincorporated communities | ||
| Footnotes | ‡This populated place also has portions in an adjacent county or counties | |