


Bureau County, Illinois
Bureau County, Illinois | |
|---|---|
 Red Covered Bridge (1863) | |
 Location within the U.S. state of Illinois | |
| Coordinates: 41°25′N 89°32′W / 41.41°N 89.53°W | |
| Country | |
| State | |
| Founded | 1837 |
| Seat | Princeton |
| Largest city | Princeton |
| Area | |
• Total | 874 sq mi (2,260 km2) |
| • Land | 869 sq mi (2,250 km2) |
| • Water | 4.5 sq mi (12 km2) 0.5% |
| Population (2020) | |
• Total | 33,244 |
• Estimate (2024) | 32,486 |
| • Density | 38.3/sq mi (14.8/km2) |
| Time zone | UTC−6 (Central) |
| • Summer (DST) | UTC−5 (CDT) |
| Congressional districts | 14th, 16th |
| Website | bureaucounty-il |
Bureau County is a county located in the U.S. state of Illinois. As of the 2020 United States census, the population was 33,244.[2] Its county seat is Princeton.[3] Bureau County is part of the Ottawa, Illinois, Micropolitan Statistical Area, and the Hennepin Canal Parkway State Park is located partly in this county.
History
Bureau County was created from a portion of Putnam County in 1837. It is named for brothers Michel and Pierre Bureau, French Canadians who ran a trading post from 1776 until the 1780s near the conjunction of Big Bureau Creek with Illinois River. Their actual surname most likely was Belleau, but the local American Indians had difficulty pronouncing the "l" sound, which was not found in some local languages.[4][5] An early settler of this area was Bulbona, a man of mixed French and Native American descent with a Native American wife. Unlike most of the other Native Americans in the area, Bulbona remained after the area was settled by Euro-Americans and ran a trading post, where he sold whiskey among other necessities.[6]
The founders of Princeton, the area's oldest town, were settlers from New England, descendants of the English Puritans who settled New England in the 17th century. They were part of a wave of New England farmers who moved to the Northwest Territory in the early 19th century. Most of them came soon after of the completion of the Erie Canal.[6] When they arrived, they faced virgin forest and wild prairie. These New Englanders laid out farms, constructed roads, erected government buildings and established post routes. They brought with them many of their Yankee New England values, such as a passion for education, establishing many schools, and were staunch abolitionists. They were mostly members of the Congregationalist Church or Episcopalians. Early Bureau County, like much of northern Illinois, was culturally very continuous with early New England culture.[7][8][6]
Like so many other areas in the Midwest, this county was on a "line" of the Underground Railroad. There was a "station" at the home of Owen Lovejoy in Princeton, and several other locations in the county.
-
 Bureau County's boundaries have remained unchanged since its creation in 1837.

Geography
According to the US Census Bureau, the county has a total area of 874 square miles (2,260 km2), of which 869 square miles (2,250 km2) is land and 4.5 square miles (12 km2) (0.5%) is water.[9] Big Bureau Creek is the main body of water.
Adjacent counties
- Whiteside County - northwest
- Lee County - north
- LaSalle County - east
- Putnam County - southeast
- Marshall County - south
- Stark County - southwest
- Henry County - west
Major highways
Climate and weather
| Princeton, Illinois | ||||||||||||||||||||||||||||||||||||||||||||||||||||||||||||
|---|---|---|---|---|---|---|---|---|---|---|---|---|---|---|---|---|---|---|---|---|---|---|---|---|---|---|---|---|---|---|---|---|---|---|---|---|---|---|---|---|---|---|---|---|---|---|---|---|---|---|---|---|---|---|---|---|---|---|---|---|
| Climate chart (explanation) | ||||||||||||||||||||||||||||||||||||||||||||||||||||||||||||
| ||||||||||||||||||||||||||||||||||||||||||||||||||||||||||||
| ||||||||||||||||||||||||||||||||||||||||||||||||||||||||||||
In recent years, average temperatures in the county seat of Princeton have ranged from a low of 14 °F (−10 °C) in January to a high of 85 °F (29 °C) in July, although a record low of −22 °F (−30 °C) was recorded in February 1996 and a record high of 102 °F (39 °C) was recorded in June 1988. Average monthly precipitation ranged from 1.48 inches (38 mm) in February to 4.76 inches (121 mm) in August.[10]
Demographics

| Census | Pop. | Note | %± |
|---|---|---|---|
| 1840 | 3,067 | — | |
| 1850 | 8,841 | 188.3% | |
| 1860 | 26,426 | 198.9% | |
| 1870 | 32,415 | 22.7% | |
| 1880 | 33,172 | 2.3% | |
| 1890 | 35,014 | 5.6% | |
| 1900 | 41,112 | 17.4% | |
| 1910 | 43,975 | 7.0% | |
| 1920 | 42,648 | −3.0% | |
| 1930 | 38,845 | −8.9% | |
| 1940 | 37,600 | −3.2% | |
| 1950 | 37,711 | 0.3% | |
| 1960 | 37,594 | −0.3% | |
| 1970 | 38,541 | 2.5% | |
| 1980 | 39,114 | 1.5% | |
| 1990 | 35,688 | −8.8% | |
| 2000 | 35,503 | −0.5% | |
| 2010 | 34,978 | −1.5% | |
| 2020 | 33,244 | −5.0% | |
| 2024 (est.) | 32,486 | [11] | −2.3% |
| US Decennial Census[12] 1790-1960[13] 1900-1990[14] 1990-2000[15] 2010-2013[2] | |||
2020 census
| Race / Ethnicity (NH = Non-Hispanic) | Pop 1980[16] | Pop 1990[17] | Pop 2000[18] | Pop 2010[19] | Pop 2020[20] | % 1980 | % 1990 | % 2000 | % 2010 | % 2020 |
|---|---|---|---|---|---|---|---|---|---|---|
| White alone (NH) | 38,085 | 34,389 | 33,196 | 31,473 | 28,511 | 97.37% | 96.36% | 93.50% | 89.98% | 85.76% |
| Black or African American alone (NH) | 43 | 50 | 110 | 191 | 259 | 0.11% | 0.14% | 0.31% | 0.55% | 0.78% |
| Native American or Alaska Native alone (NH) | 125 | 61 | 53 | 63 | 49 | 0.32% | 0.17% | 0.15% | 0.18% | 0.15% |
| Asian alone (NH) | 52 | 182 | 181 | 220 | 298 | 0.13% | 0.51% | 0.51% | 0.63% | 0.90% |
| Native Hawaiian or Pacific Islander alone (NH) | x [21] | x [22] | 10 | 6 | 21 | x | x | 0.03% | 0.02% | 0.06% |
| Other race alone (NH) | 0 | 3 | 6 | 4 | 51 | 0.00% | 0.01% | 0.02% | 0.01% | 0.15% |
| Mixed race or Multiracial (NH) | x [23] | x [24] | 215 | 326 | 960 | x | x | 0.61% | 0.93% | 2.89% |
| Hispanic or Latino (any race) | 809 | 1,003 | 1,732 | 2,695 | 3,095 | 2.07% | 2.81% | 4.88% | 7.70% | 9.31% |
| Total | 39,114 | 35,688 | 35,503 | 34,978 | 33,244 | 100.00% | 100.00% | 100.00% | 100.00% | 100.00% |
As of the 2020 census, the county had a population of 33,244. The median age was 44.8 years. 21.2% of residents were under the age of 18 and 22.4% of residents were 65 years of age or older. For every 100 females there were 97.6 males, and for every 100 females age 18 and over there were 95.5 males age 18 and over.[25][26]
The racial makeup of the county was 88.3% White, 0.8% Black or African American, 0.4% American Indian and Alaska Native, 0.9% Asian, 0.1% Native Hawaiian and Pacific Islander, 3.3% from some other race, and 6.2% from two or more races. Hispanic or Latino residents of any race comprised 9.3% of the population.[26]
45.0% of residents lived in urban areas, while 55.0% lived in rural areas.[27]
There were 14,179 households in the county, of which 26.4% had children under the age of 18 living in them. Of all households, 47.4% were married-couple households, 19.4% were households with a male householder and no spouse or partner present, and 25.5% were households with a female householder and no spouse or partner present. About 31.7% of all households were made up of individuals and 15.2% had someone living alone who was 65 years of age or older.[25]
There were 15,616 housing units, of which 9.2% were vacant. Among occupied housing units, 74.8% were owner-occupied and 25.2% were renter-occupied. The homeowner vacancy rate was 1.8% and the rental vacancy rate was 7.1%.[25]
2010 census
As of the 2010 United States census, there were 34,978 people, 14,262 households, and 9,605 families residing in the county.[28] The population density was 40.2 inhabitants per square mile (15.5/km2). There were 15,720 housing units at an average density of 18.1 per square mile (7.0/km2).[9] The racial makeup of the county was 94.2% white, 0.7% Asian, 0.6% black or African American, 0.3% American Indian, 3.0% from other races, and 1.3% from two or more races. Those of Hispanic or Latino origin made up 7.7% of the population. In terms of ancestry, 32.8% were German, 13.8% were Irish, 12.1% were English, 9.2% were American, 8.8% were Italian, 7.6% were Swedish, and 5.8% were Polish.[29]
Of the 14,262 households, 29.8% had children under the age of 18 living with them, 53.6% were married couples living together, 9.2% had a female householder with no husband present, 32.7% were non-families, and 28.0% of all households were made up of individuals. The average household size was 2.42 and the average family size was 2.94. The median age was 42.5 years.
The median income for a household in the county was $45,692 and the median income for a family was $55,217. Males had a median income of $42,327 versus $29,210 for females. The per capita income for the county was $24,103. About 8.6% of families and 11.1% of the population were below the poverty line, including 15.3% of those under age 18 and 7.5% of those age 65 or over.[30]
Communities
| Community |
Community type |
Population | Total Area |
Water Area |
Land Area |
Pop. Density | |
|---|---|---|---|---|---|---|---|
| Arlington | village | 169 | 0.40 | 0.00 | 0.40 | 427.85 | |
| Buda | village | 482 | 1.01 | 0.00 | 1.01 | 475.35 | |
| Bureau Junction | village | 281 | 1.51 | 0.07 | 1.45 | 190 | |
| Cherry | village | 435 | 0.51 | 0.00 | 0.51 | 850 | |
| Dalzell (part) | village | 663 | 0.83 | 0.01 | 0.82 | 808.54 | |
| DePue | village | 1,633 | 2.55 | 0.11 | 2.45 | 667.35 | |
| Dover | village | 135 | 0.29 | 0.00 | 0.28 | 470 | |
| Hollowayville | village | 36 | 0.05 | 0.00 | 0.05 | 734.69 | |
| La Moille | village | 679 | 1.16 | 0.00 | 1.16 | 590 | |
| Ladd | village | 1,263 | 1.21 | 0.00 | 1.21 | 1,000 | |
| Malden | village | 318 | 0.27 | 0.00 | 0.27 | 1,164.84 | |
| Manlius | village | 298 | 0.32 | 0.00 | 0.32 | 934.17 | |
| Mineral | village | 206 | 0.553 | 0.00 | 0.553 | 370 | |
| Neponset | village | 427 | 1.016 | 0.00 | 1.016 | 420 | |
| New Bedford | village | 76 | 0.155 | 0.00 | 0.155 | 490 | |
| Ohio | village | 465 | 0.753 | 0.00 | 0.753 | 620 | |
| Princeton (seat) | city | 7,832 | 8.24 | 0.00 | 8.24 | 950.49 | |
| Seatonville | village | 321 | 0.511 | 0.015 | 0.496 | 630 | |
| Sheffield | village | 821 | 1.169 | 0.00 | 1.169 | 700 | |
| Spring Valley | city | 5,582 | 7.40 | 0.04 | 7.36 | 750 | |
| Tiskilwa | village | 740 | 0.517 | 0.00 | 0.517 | 1,400 | |
| Walnut | village | 1,311 | 0.801 | 0.00 | 0.801 | 1,600 | |
| Wyanet | village | 886 | 0.946 | 0.00 | 0.946 | 940 | |
| Bureau County | county | 33,244 | 874 | 4.5 | 869 | 38 |
Unincorporated communities
Townships
Education
K-12 school districts include:[31]
- Annawan Community Unit School District 226
- Bureau Valley Community Unit School District 340
- Bradford Community Unit School District 1
- Depue Community Unit School District 103
- Henry-Senachwine Consolidated Unit School District 5
- Kewanee Community Unit School District 229
- La Moille Community Unit School District 303
- Prophetstown-Lyndon-Tampico Community Unit School District 3
- Wethersfield Community Unit School District 230
Secondary school districts include:[31]
Elementary school districts include:[31]
- Dalzell School District 98
- Dimmick Community Consolidated School District 175
- Ladd Community Consolidated School District 94
- Malden Community Consolidated School District 84
- Mendota Community Consolidated School District 289
- Ohio Community Consolidated School District 17
- Princeton Elementary School District 115
- Spring Valley Community Consolidated School District 99
Notable people
- Charles W. Brooks, U.S. Senator
- Warren Giles, executive in Baseball Hall of Fame
- Virgil Fox, concert organist
- Kathryn Hays, actress
- Owen Lovejoy, abolitionist minister and U.S. congressman
- Rufus Lumry, abolitionist circuit preacher and early Illinois organizer of the Wesleyan Methodist Church
- Joseph R. Peterson, Illinois state legislator and lawyer
- Robert Petkoff, actor
- Eliza Suggs, author and temperance activist
- Richard Widmark, actor
Politics
As part of Yankee-settled Northern Illinois, Bureau County became powerfully Republican for the century following the Civil War. The only Democrat to carry the county between 1856 and 1988 was Franklin D. Roosevelt during his landslide 1932 victory, although Progressive Theodore Roosevelt did carry the county during the 1912 election. Between 1988 and 2012, the county trended Democratic – Bill Clinton won pluralities in both his elections and Barack Obama won an absolute majority in 2008 and nearly did so in 2012 – however concern with lack of employment opportunities in the Rust Belt led to a powerful swing toward Donald Trump in 2016 for the best GOP result since Ronald Reagan’s 1984 landslide.
| Year | Republican | Democratic | Third party(ies) | |||
|---|---|---|---|---|---|---|
| No. | % | No. | % | No. | % | |
| 1892 | 3,924 | 47.96% | 3,555 | 43.45% | 702 | 8.58% |
| 1896 | 5,474 | 56.31% | 3,961 | 40.74% | 287 | 2.95% |
| 1900 | 5,478 | 56.90% | 3,523 | 36.59% | 626 | 6.50% |
| 1904 | 5,624 | 64.31% | 1,917 | 21.92% | 1,204 | 13.77% |
| 1908 | 5,280 | 57.48% | 2,871 | 31.25% | 1,035 | 11.27% |
| 1912 | 1,816 | 19.84% | 2,800 | 30.59% | 4,537 | 49.57% |
| 1916 | 8,213 | 56.20% | 5,793 | 39.64% | 608 | 4.16% |
| 1920 | 9,968 | 74.94% | 2,354 | 17.70% | 980 | 7.37% |
| 1924 | 9,457 | 60.38% | 1,995 | 12.74% | 4,211 | 26.89% |
| 1928 | 11,557 | 63.73% | 6,486 | 35.77% | 90 | 0.50% |
| 1932 | 8,721 | 45.23% | 10,309 | 53.47% | 250 | 1.30% |
| 1936 | 10,462 | 51.48% | 9,516 | 46.83% | 344 | 1.69% |
| 1940 | 13,258 | 61.36% | 8,274 | 38.29% | 75 | 0.35% |
| 1944 | 11,802 | 62.68% | 6,976 | 37.05% | 51 | 0.27% |
| 1948 | 11,207 | 63.15% | 6,463 | 36.42% | 78 | 0.44% |
| 1952 | 14,300 | 69.76% | 6,173 | 30.12% | 25 | 0.12% |
| 1956 | 13,909 | 70.56% | 5,781 | 29.33% | 21 | 0.11% |
| 1960 | 12,597 | 61.73% | 7,786 | 38.15% | 24 | 0.12% |
| 1964 | 9,552 | 51.25% | 9,086 | 48.75% | 0 | 0.00% |
| 1968 | 11,216 | 59.97% | 6,304 | 33.71% | 1,183 | 6.33% |
| 1972 | 12,786 | 67.47% | 6,133 | 32.36% | 33 | 0.17% |
| 1976 | 10,854 | 58.20% | 7,566 | 40.57% | 228 | 1.22% |
| 1980 | 11,484 | 61.79% | 5,753 | 30.95% | 1,350 | 7.26% |
| 1984 | 11,741 | 62.57% | 6,925 | 36.90% | 99 | 0.53% |
| 1988 | 8,896 | 54.41% | 7,354 | 44.98% | 101 | 0.62% |
| 1992 | 6,836 | 38.18% | 7,551 | 42.17% | 3,520 | 19.66% |
| 1996 | 6,528 | 40.61% | 7,651 | 47.60% | 1,894 | 11.78% |
| 2000 | 8,526 | 50.68% | 7,754 | 46.09% | 543 | 3.23% |
| 2004 | 9,822 | 54.87% | 7,961 | 44.47% | 119 | 0.66% |
| 2008 | 7,911 | 46.12% | 8,889 | 51.82% | 353 | 2.06% |
| 2012 | 8,164 | 48.93% | 8,134 | 48.75% | 388 | 2.33% |
| 2016 | 9,281 | 56.01% | 6,029 | 36.38% | 1,261 | 7.61% |
| 2020 | 10,411 | 59.51% | 6,669 | 38.12% | 414 | 2.37% |
| 2024 | 9,784 | 60.88% | 5,900 | 36.71% | 387 | 2.41% |
See also
References
- Specific
- ^ "County Population Totals and Components of Change: 2020–2024". United States Census Bureau. U.S. Department of Commerce. March 2025. Retrieved August 31, 2025.
- ^ a b "State & County QuickFacts". United States Census Bureau. Retrieved January 23, 2023.
- ^ "Find a County". National Association of Counties. Archived from the original on May 31, 2011. Retrieved June 7, 2011.
- ^ Pierre de Beuro, an Indian trader Pioneers of Illinois by Nehemiah Matson, 1882, p. 229
- ^ Jean Baptiste Point de Sable : the founder of modern Chicago Archived January 26, 2013, at the Wayback Machine by John F. Swenson, 1999- . Retrieved November 11, 2010.
- ^ a b c Bradsby, Henry C. (May 11, 1885). "History of Bureau County, Illinois". Chicago : World Pub. Co. Archived from the original on January 31, 2010 – via Internet Archive.
- ^ Nehemiah Matson (1872). Reminiscences of Bureau County [Illinois] in Two Parts. Republican book and job office. pp. 265–.
- ^ Harrington, George B. (May 11, 2018). Past and Present of Bureau County, Illinois: Together with Biographical Sketches of Many of Its Prominent and Leading Citizens and Illustrious Dead. Pioneer Publishing Co. ISBN 9780608368887 – via Google Books.
- ^ a b "Population, Housing Units, Area, and Density: 2010 - County". US Census Bureau. Retrieved July 11, 2015.
{{cite web}}: CS1 maint: deprecated archival service (link) - ^ a b "Monthly Averages for Princeton IL". The Weather Channel. Archived from the original on October 23, 2012. Retrieved January 27, 2011.
- ^ "Population and Housing Unit Estimates Tables". United States Census Bureau. Retrieved July 24, 2025.
- ^ "US Decennial Census". US Census Bureau. Retrieved July 3, 2014.
- ^ "Historical Census Browser". University of Virginia Library. Archived from the original on August 11, 2012. Retrieved July 3, 2014.
- ^ "Population of Counties by Decennial Census: 1900 to 1990". US Census Bureau. Archived from the original on April 24, 2014. Retrieved July 3, 2014.
- ^ "Census 2000 PHC-T-4. Ranking Tables for Counties: 1990 and 2000" (PDF). US Census Bureau. Archived (PDF) from the original on December 18, 2014. Retrieved July 3, 2014.
- ^ "1980 Census of Population - General Population Characteristics - Illinois- Table 14 - Persons by Race and Table 16 (p. 18-28) - Total Persons and Spanish Origin Persons by Type of Spanish Origin and Race (p. 29-39)" (PDF). United States Census Bureau.
- ^ "1990 Census of Population - General Population Characteristics - Illinois - Table 6 - Race and Hispanic Orogin" (PDF). United States Census Bureau.
- ^ "P004: Hispanic or Latino, and Not Hispanic or Latino by Race – 2000: DEC Summary File 1 – Bureau County, Illinois". United States Census Bureau.
- ^ "P2: Hispanic or Latino, and Not Hispanic or Latino by Race – 2010: DEC Redistricting Data (PL 94-171) – Bureau County, Illinois". United States Census Bureau.
- ^ "P2: Hispanic or Latino, and Not Hispanic or Latino by Race – 2020: DEC Redistricting Data (PL 94-171) – Bureau County, Illinois". United States Census Bureau.
- ^ included in the Asian category in the 1980 Census
- ^ included in the Asian category in the 1990 Census
- ^ not an option in the 1980 Census
- ^ not an option in the 1990 Census
- ^ a b c "2020 Decennial Census Demographic Profile (DP1)". United States Census Bureau. 2021. Retrieved December 25, 2025.
- ^ a b "2020 Decennial Census Redistricting Data (Public Law 94-171)". United States Census Bureau. 2021. Retrieved December 25, 2025.
- ^ "2020 Decennial Census Demographic and Housing Characteristics (DHC)". United States Census Bureau. 2023. Retrieved December 25, 2025.
- ^ "Profile of General Population and Housing Characteristics: 2010 Demographic Profile Data". US Census Bureau. Retrieved July 11, 2015.
{{cite web}}: CS1 maint: deprecated archival service (link) - ^ "Selected Social Characteristics in the United States – 2006-2010 American Community Survey 5-Year Estimates". US Census Bureau. Retrieved July 11, 2015.
{{cite web}}: CS1 maint: deprecated archival service (link) - ^ "Selected Economic Characteristics – 2006-2010 American Community Survey 5-Year Estimates". US Census Bureau. Retrieved July 11, 2015.
{{cite web}}: CS1 maint: deprecated archival service (link) - ^ a b c Geography Division (December 22, 2020). 2020 CENSUS - SCHOOL DISTRICT REFERENCE MAP: Bureau County, IL (PDF) (Map). U.S. Census Bureau. Retrieved June 17, 2025. - Text list
- ^ Leip, David. "Atlas of U.S. Presidential Elections". uselectionatlas.org. Archived from the original on March 23, 2018.
- General
External links
Places adjacent to Bureau County, Illinois | ||||||||||||||||
|---|---|---|---|---|---|---|---|---|---|---|---|---|---|---|---|---|
| ||||||||||||||||
Municipalities and communities of Bureau County, Illinois, United States | ||
|---|---|---|
| Cities | 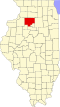 | |
| Villages | ||
| Townships | ||
| Unincorporated communities | ||
| Ghost town | ||
| Footnotes | ‡This populated place also has portions in an adjacent county or counties | |
| International | |
|---|---|
| National | |
| Other | |