


Kauai County, Hawaii
Kauai County, Hawaii | |
|---|---|
 | |
 Seal | |
 Location within the U.S. state of Hawaii | |
| Coordinates: 22°04′00″N 159°39′00″W / 22.066666666667°N 159.65°W | |
| Country | |
| State | |
| Founded | 1905 |
| Seat | Līhuʻe |
| Largest community | Kapa‘a |
| Government | |
| • Mayor | Derek Kawakami |
| Area | |
• Total | 1,266 sq mi (3,280 km2) |
| • Land | 620 sq mi (1,600 km2) |
| • Water | 646 sq mi (1,670 km2) 51.0% |
| Population (2020) | |
• Total | 73,298 |
| • Density | 120/sq mi (46/km2) |
| Time zone | UTC−10 (Hawaii–Aleutian) |
| Congressional district | 2nd |
| Website | kauai |
Kauai County or Kauaʻi County (Hawaiian: Kalana o Kauaʻi), officially known as the County of Kauaʻi, is a county in the U.S. state of Hawaiʻi. It encompasses the islands of Kauaʻi, Niʻihau, Lehua, and Kaʻula. According to the 2020 Census, the population was 73,298.[1] The county seat is Līhuʻe.[2]
The Kapa'a Micropolitan Statistical Area includes all of Kauai County.
Geography
According to the U.S. Census Bureau, the county has a total area of 1,266 square miles (3,280 km2), of which 620 square miles (1,600 km2) is land and 646 square miles (1,670 km2) (51.0%) is water.[3] The Pacific Ocean surrounds the county.
Adjacent entities
- Honolulu County, Hawaii - southeast
- Midway Atoll - northwest
National protected areas
- Hanalei National Wildlife Refuge
- Huleia National Wildlife Refuge
- Kilauea Point National Wildlife Refuge
Communities
There are no incorporated communities in Kauai County, or in any other county of Hawaii. The county is the only form of local government in the State of Hawaii.
Census-designated places
Other unincorporated places
Demographics
| Census | Pop. | Note | %± |
|---|---|---|---|
| 1900 | 20,734 | — | |
| 1910 | 23,952 | 15.5% | |
| 1920 | 29,438 | 22.9% | |
| 1930 | 35,942 | 22.1% | |
| 1940 | 35,818 | −0.3% | |
| 1950 | 29,905 | −16.5% | |
| 1960 | 28,176 | −5.8% | |
| 1970 | 29,761 | 5.6% | |
| 1980 | 39,082 | 31.3% | |
| 1990 | 51,177 | 30.9% | |
| 2000 | 58,463 | 14.2% | |
| 2010 | 67,091 | 14.8% | |
| 2020 | 73,298 | 9.3% | |
| 2024 (est.) | 73,840 | [4] | 0.7% |
| U.S. Decennial Census[5] 1790-1960[6] 1900-1990[7] 1990-2000[8] 2010-2020[1] | |||
2020 census
As of the 2020 census, the county had a population of 73,298. Of the residents, 21.5% were under the age of 18 and 21.2% were 65 years of age or older; the median age was 43.0 years. For every 100 females there were 97.5 males, and for every 100 females age 18 and over there were 96.2 males. 57.8% of residents lived in urban areas and 42.2% lived in rural areas.[9]
The racial makeup of the county was 31.7% White, 0.5% Black or African American, 0.4% American Indian and Alaska Native, 28.8% Asian, 9.9% Native Hawaiian and Pacific Islander, 1.5% from some other race, and 27.3% from two or more races. Hispanic or Latino residents of any race comprised 10.1% of the population.[10]
There were 24,712 households in the county, of which 33.8% had children under the age of 18 living with them and 24.5% had a female householder with no spouse or partner present. About 21.6% of all households were made up of individuals and 11.1% had someone living alone who was 65 years of age or older.[11]
There were 30,157 housing units, of which 18.1% were vacant. Among occupied housing units, 62.8% were owner-occupied and 37.2% were renter-occupied. The homeowner vacancy rate was 1.1% and the rental vacancy rate was 13.4%.[11]
| Race / Ethnicity (NH = Non-Hispanic) | Pop 1980[12] | Pop 1990[13] | Pop 2000[14] | Pop 2010[15] | Pop 2020[16] | % 1980 | % 1990 | % 2000 | % 2010 | % 2020 |
|---|---|---|---|---|---|---|---|---|---|---|
| White alone (NH) | 10,109 | 16,235 | 16,284 | 20,611 | 22,194 | 25.87% | 31.72% | 27.85% | 30.72% | 30.28% |
| Black or African American alone (NH) | 64 | 193 | 163 | 258 | 352 | 0.16% | 0.38% | 0.28% | 0.38% | 0.48% |
| Native American or Alaska Native alone (NH) | 78 | 149 | 138 | 158 | 156 | 0.20% | 0.29% | 0.24% | 0.24% | 0.21% |
| Asian alone (NH) | 25,561 | 28,914 | 20,412 | 20,296 | 20,504 | 65.40% | 56.50% | 34.91% | 30.25% | 27.97% |
| Native Hawaiian or Pacific Islander alone (NH) | x [17] | x [18] | 5,077 | 5,716 | 6,825 | x | x | 8.68% | 8.52% | 9.31% |
| Other race alone (NH) | 0 | 106 | 82 | 74 | 283 | 0.00% | 0.21% | 0.14% | 0.11% | 0.39% |
| Mixed race or Multiracial (NH) | x [19] | x [20] | 11,504 | 13,663 | 15,590 | x | x | 19.68% | 20.36% | 21.27% |
| Hispanic or Latino (any race) | 3,270 | 5,580 | 4,803 | 6,315 | 7,394 | 8.37% | 10.90% | 8.22% | 9.41% | 10.09% |
| Total | 39,082 | 51,177 | 58,463 | 67,091 | 73,298 | 100.00% | 100.00% | 100.00% | 100.00% | 100.00% |
2000 census
At the 2000 census there were 58,463 people, 20,183 households, and 14,572 families in the county. The population density was 94 people per square mile (36 people/km2). There were 25,331 housing units at an average density of 41 per square mile (16/km2). The racial makeup of the county was 36.0% Asian, 29.5% White, 23.8% from two or more races, 9.1% Pacific Islander, 0.3% Black or African American, 0.4% Native American and 0.9% from other races. 8.2%.[21] were Hispanic or Latino of any race.
Of the 20,183 households 34.0% had children under the age of 18 living with them, 53.9% were married couples living together, 12.8% had a female householder with no husband present, and 27.8% were non-families. 21.4% of households were one person and 7.7% were one person aged 65 or older. The average household size was 2.87 and the average family size was 3.34.
The age distribution was 26.4% under the age of 18, 7.1% from 18 to 24, 27.2% from 25 to 44, 25.5% from 45 to 64, and 13.8% 65 or older. The median age was 38 years. For every 100 females there were 100.10 males. For every 100 females age 18 and over, there were 97.50 males.
Economy
Top employers
According to the county's 2022 Annual Comprehensive Financial Report,[22] the top non-government employers in the county are the following:
| # | Employer | # of Employees |
|---|---|---|
| 1 | Wilcox Health (Wilcox Medical Center) | 846 |
| 2 | Grand Hyatt Kauai Resort and Spa | 810 |
| 3 | Ohana Pacific Management Co. | 371 |
| 4 | Kauai Veterans Memorial Hospital | 275 |
| 5 | Kauai Beach Resort | 160 |
| 6 | Samuel Mahelona Memorial Hospital | 148 |
| 7 | Kauaʻi Island Utility Cooperative | 140 |
| 8 | Kauai Nursery & Landscaping Inc. | 97 |
| 9 | Gather FCU | 88 |
| 10 | The Parrish Collection | 85 |
Education
Higher education
Kauaʻi Community College is the county's only institution of higher education. One of the ten branches of the University of Hawaiʻi system, it offers a range of 2-year degrees and is accredited by the Western Association of Schools and Colleges.
Primary and Secondary Education
Public schools in the county are operated by the Hawaiʻi State Department of Education,[23] and the county is represented by Maggie Cox on the state's Board of Education. There are 10 elementary schools, 3 middle schools, 3 high schools, and 5 K-12 schools in the county.
High schools
Middle schools
- Chiefess Kamakahelei Middle School
- Kapa'a Middle School
- Waimea Canyon Middle School
Elementary schools
- Alakaʻi O Kauaʻi Public Charter School
- Eleele Elementary School
- Hanalei Elementary School
- Kalaheo Elementary School
- Kapaʻa Elementary
- Kaumualii Elementary School
- Kekaha Elementary School
- Kilauea Elementary School
- Kōloa Elementary School
- Wilcox Elementary School
K-12 Schools
- Kanuikapono Public Charter School
- Kawaikini New Century Public Charter School
- Ke Kula Niʻihau O Kekaha Learning Center
- Kula Aupuni Niʻihau A Kahelelani Aloha
- Niʻihau High & Elementary
Private schools
There are four private schools in the county: Island School, Kahili Adventist School, St. Theresa's Elementary School, and ʻŌlelo Christian Academy. St. Catherine's School used to operate, but closed its doors on June 7, 2024.[24]
Infrastructure
Transportation
Lihue Airport serves the island of Kauaʻi. Bus service is provided by The Kauai Bus.
- Major Highways
 Route 50
 Route 51
 Route 56
 Route 58
 Route 520
 Route 540
 Route 550
 Route 570
 Route 580
 Route 581
 Route 583
Government and politics
| Year | Republican | Democratic | Third party(ies) | |||
|---|---|---|---|---|---|---|
| No. | % | No. | % | No. | % | |
| 2024 | 8,537 | 29.96% | 18,934 | 66.45% | 1,024 | 3.59% |
| 2018 | 6,120 | 24.85% | 18,510 | 75.15% | 0 | 0.00% |
| 2012 | 7,134 | 28.41% | 17,973 | 71.59% | 0 | 0.00% |
| Year | Republican | Democratic | Third party(ies) | |||
|---|---|---|---|---|---|---|
| No. | % | No. | % | No. | % | |
| 2022 | 5,658 | 24.28% | 16,891 | 72.50% | 750 | 3.22% |
| 2016 | 4,745 | 19.00% | 19,015 | 76.13% | 1,216 | 4.87% |
| 2014 | 5,250 | 23.89% | 16,189 | 73.67% | 537 | 2.44% |
| 2010 | 3,732 | 17.09% | 17,192 | 78.72% | 915 | 4.19% |
Kauaʻi County operates under a mayor-council form of municipal government. The Mayor of Kauaʻi, elected by the voters on a nonpartisan basis, holds executive authority for a four-year term. Meanwhile, legislative authority is vested in the seven-member County Council. Members of the County Council are elected on a nonpartisan, at-large basis to two-year terms.
United States Congress
Kauaʻi County, like the rest of Hawaii, is represented entirely by Democrats in both the United States Senate and the United States House of Representatives.
| Senators | Name | Party | First Elected | Level | |
|---|---|---|---|---|---|
| Senate Class 1 | Mazie Hirono | Democratic | 2013 | Junior Senator | |
| Senate Class 3 | Brian Schatz | Democratic | 2012 | Senior Senator | |
| Representatives | Name | Party | First Elected | Area(s) of Kauai County Represented | |
| District 2 | Jill Tokuda | Democratic | 2023 | entire county | |
Hawaii Legislature
Hawaii Senate
| District | Name | Party | First Elected | Area(s) of Kauai County Represented | |
|---|---|---|---|---|---|
| 8 | Ron Kouchi | Democratic | 2010 | entire county | |
Hawaii House of Representatives
| District | Name | Party | First Elected | Area(s) of Kauai County Represented | |
|---|---|---|---|---|---|
| 15 | Nadine Nakamura | Democratic | 2016 | Hā‘ena, Wainiha, Hanalei, Princeville, Kīlauea, Anahola, Keālia, Kāpa‘a, portion of Wailuā, Kawaihau | |
| 16 | Luke Evslin | Democratic | 2023[a] | Wailuā, Hanamāʻulu, Kapaia, Līhuʻe, Puhi, portion of ʻŌmaʻo | |
| 17 | Dee Morikawa | Democratic | 2011 | Niʻihau, portion of ʻŌmaʻo, Kōloa, Po‘ipū, Lāwa‘i, Kalāheo, ‘Ele‘ele, Hanapēpē, Kaawanui Village, Pākalā Village, Waimea, Kekaha | |
Elections
| Year | Republican | Democratic | Third party(ies) | |||
|---|---|---|---|---|---|---|
| No. | % | No. | % | No. | % | |
| 2022 | 9,632 | 40.37% | 14,227 | 59.63% | 0 | 0.00% |
| 2018 | 8,135 | 32.76% | 15,868 | 63.90% | 830 | 3.34% |
| 2014 | 7,495 | 31.99% | 12,451 | 53.14% | 3,483 | 14.87% |
| 2010 | 8,953 | 39.50% | 13,559 | 59.82% | 156 | 0.69% |
| Year | Republican | Democratic | Third party(ies) | |||
|---|---|---|---|---|---|---|
| No. | % | No. | % | No. | % | |
| 1960 | 5,655 | 54.95% | 4,636 | 45.05% | 0 | 0.00% |
| 1964 | 1,971 | 18.45% | 8,713 | 81.55% | 0 | 0.00% |
| 1968 | 4,140 | 36.49% | 7,051 | 62.15% | 155 | 1.37% |
| 1972 | 7,571 | 58.36% | 5,401 | 41.64% | 0 | 0.00% |
| 1976 | 6,278 | 43.23% | 8,105 | 55.81% | 139 | 0.96% |
| 1980 | 5,883 | 35.39% | 9,081 | 54.64% | 1,657 | 9.97% |
| 1984 | 9,249 | 50.45% | 8,862 | 48.34% | 221 | 1.21% |
| 1988 | 8,298 | 40.95% | 11,770 | 58.08% | 198 | 0.98% |
| 1992 | 6,274 | 32.80% | 10,715 | 56.02% | 2,138 | 11.18% |
| 1996 | 5,325 | 25.33% | 13,357 | 63.54% | 2,338 | 11.12% |
| 2000 | 6,583 | 30.23% | 13,470 | 61.87% | 1,720 | 7.90% |
| 2004 | 9,740 | 39.15% | 14,916 | 59.96% | 220 | 0.88% |
| 2008 | 6,245 | 22.94% | 20,416 | 74.99% | 563 | 2.07% |
| 2012 | 6,121 | 24.13% | 18,641 | 73.47% | 610 | 2.40% |
| 2016 | 7,574 | 28.76% | 16,456 | 62.49% | 2,305 | 8.75% |
| 2020 | 11,582 | 34.58% | 21,225 | 63.36% | 690 | 2.06% |
| 2024 | 11,803 | 39.26% | 17,675 | 58.79% | 586 | 1.95% |
Kauai County, like Hawaii in general, has traditionally been a stronghold of the Democratic Party. The county has not voted for a Republican presidential candidate since 1984, when it narrowly voted in favor of Ronald Reagan. In 2024, while it still voted majority Democratic, Kauai County cast the highest percentage for the Republican candidate of any county in the state, a distinction that has generally been held by Honolulu County; this was the first time Kauai County had done so since 1960.[29] The island of Kauai leans Democratic overall. The island of Ni'ihau, which has a very small population, tends to vote almost entirely Republican, by far the strongest such leaning of all major Hawaiian islands.[30]
Sister cities
Kauai County's sister cities are:[31]
Notes
- ^ Appointed to seat on February 15, 2023, by Governor Josh Green after James Tokioka was appointed to join the governor's cabinet.[26]
References
- ^ a b "U.S. Census Bureau QuickFacts: Kauai County, Hawaii". United States Census Bureau. Retrieved June 28, 2014.
- ^ "Find a County". National Association of Counties. Archived from the original on May 31, 2011. Retrieved June 7, 2011.
- ^ "US Gazetteer files: 2010, 2000, and 1990". United States Census Bureau. February 12, 2011. Retrieved April 23, 2011.
- ^ "County Population Totals and Components of Change: 2020-2024". United States Census Bureau. Retrieved May 15, 2025.
- ^ "U.S. Decennial Census". United States Census Bureau. Retrieved June 28, 2014.
- ^ "Historical Census Browser". University of Virginia Library. Retrieved June 28, 2014.
- ^ "Population of Counties by Decennial Census: 1900 to 1990". United States Census Bureau. Retrieved June 28, 2014.
- ^ "Census 2000 PHC-T-4. Ranking Tables for Counties: 1990 and 2000" (PDF). United States Census Bureau. Retrieved June 28, 2014.
- ^ "2020 Decennial Census Demographic and Housing Characteristics (DHC)". United States Census Bureau. United States Census Bureau. 2023. Retrieved 2025-12-07.
- ^ "2020 Decennial Census Redistricting Data (Public Law 94-171)". United States Census Bureau. United States Census Bureau. 2021. Retrieved 2025-12-08.
- ^ a b "2020 Decennial Census Demographic Profile (DP1)". United States Census Bureau. United States Census Bureau. 2021. Retrieved 2025-12-07.
- ^ "Hawaii: 1980, General Social and Economic Characteristics, Table 59: Persons by Race, Hispanic Origin, and Sex" (PDF). United States Census Bureau.
- ^ "Hawaii: 1990, General Social and Economic Characteristics, Table 6: Race and Hispanic Origin" (PDF). United States Census Bureau.
- ^ "P004: Hispanic or Latino, and Not Hispanic or Latino by Race – 2000: DEC Summary File 1 – Kauai County, Hawaii". United States Census Bureau.
- ^ "P2: Hispanic or Latino, and Not Hispanic or Latino by Race – 2010: DEC Redistricting Data (PL 94-171) – Kauai County, Hawaii". United States Census Bureau.
- ^ "P2: Hispanic or Latino, and Not Hispanic or Latino by Race – 2020: DEC Redistricting Data (PL 94-171) – Kauai County, Hawaii". United States Census Bureau.
- ^ included in the Asian category in the 1980 Census
- ^ included in the Asian category in the 1990 Census
- ^ not an option in the 1980 Census
- ^ not an option in the 1990 Census
- ^ "U.S. Census website". United States Census Bureau. Retrieved January 31, 2008.
- ^ The Department of Finance, Accounting Division. "Annual Comprehensive Financial Report for the Fiscal Year Ended June 30, 2022". Retrieved November 12, 2023.
- ^ "2020 CENSUS - SCHOOL DISTRICT REFERENCE MAP: Kauai County, HI" (PDF). U.S. Census Bureau. Retrieved July 22, 2022. - Text list
- ^ "St. Catherine School". St. Catherine School. Retrieved December 15, 2024.
- ^ a b Leip, David. "Dave Leip's Atlas of U.S. Presidential Elections". uselectionatlas.org. Retrieved February 11, 2026.
- ^ "Green makes appointments for open House seats". February 15, 2023. Retrieved March 14, 2023.
- ^ Leip, David. "Dave Leip's Atlas of U.S. Presidential Elections". uselectionatlas.org. Retrieved February 11, 2026.
- ^ Leip, David. "Dave Leip's Atlas of U.S. Presidential Elections". uselectionatlas.org. Retrieved November 10, 2024.
- ^ "Dave Leip's Atlas of U.S. Presidential Elections".
- ^ Datar, Saurabh; Marcus, Ilana; Murray, Eli; Singer, Ethan; Lemonides, Alex; Zhang, Christine (January 15, 2025). "An Extremely Detailed Map of the 2024 Election". The New York Times.
- ^ "Sister City program worth continuing". thegardenisland.com. The Garden Island. October 6, 2019. Retrieved April 27, 2021.
- ^ a b "Kauai mayor visits Japan keeping communities together, worlds apart". kitv.com. KITV Island News. November 22, 2015. Archived from the original on April 27, 2021. Retrieved April 27, 2021.
- ^ "Tahiti sister-city students come to call". thegardenisland.com. The Garden Island. May 18, 2018. Retrieved April 27, 2021.
- ^ "Music strengthens sister city bond with Whitby". thegardenisland.com. The Garden Island. February 12, 2013. Retrieved April 27, 2021.
External links
Islands, municipalities, and communities of Kauai County, Hawaii, United States | ||
|---|---|---|
| CDPs | 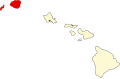 | |
| Other communities | ||
State of Hawaii | |
|---|---|
Honolulu (capital) | |
| Topics | |
| Society | |
| Main islands | |
| Northwestern Islands | |
| Counties | |
| Pre-statehood history | |
| International | |
|---|---|
| National | |
| Geographic | |
| Other | |