


Live Oak County, Texas
Live Oak County, Texas | |
|---|---|
 The Live Oak County Courthouse in George West | |
 Location within the U.S. state of Texas | |
| Coordinates: 28°21′N 98°08′W / 28.35°N 98.13°W | |
| Country | |
| State | |
| Founded | 1856 |
| Named after | Groves of live oak |
| Seat | George West |
| Largest city | George West |
| Area | |
• Total | 1,079 sq mi (2,790 km2) |
| • Land | 1,040 sq mi (2,700 km2) |
| • Water | 39 sq mi (100 km2) 3.6% |
| Population (2020) | |
• Total | 11,335 |
| • Density | 11/sq mi (4.2/km2) |
| Time zone | UTC−6 (Central) |
| • Summer (DST) | UTC−5 (CDT) |
| Congressional district | 15th |
| Website | www |
Live Oak County is a county in the U.S. state of Texas. It was named for its native groves of live oak.[1] George West is its county seat.[2] Its population was 11,335 in the 2020 census.[3]
Geography
According to the U.S. Census Bureau, the county has a total area of 1,079 square miles (2,790 km2), of which 39 sq mi (100 km2) (3.6%) are covered by water.[4] It is home to the Choke Canyon Reservoir.
Major highways
Adjacent counties
- Karnes County (northeast)
- Bee County (east)
- San Patricio County (southeast)
- Jim Wells County (south)
- Duval County (southwest)
- McMullen County (west)
- Atascosa County (northwest)
Demographics
| Census | Pop. | Note | %± |
|---|---|---|---|
| 1860 | 593 | — | |
| 1870 | 852 | 43.7% | |
| 1880 | 1,994 | 134.0% | |
| 1890 | 2,055 | 3.1% | |
| 1900 | 2,268 | 10.4% | |
| 1910 | 3,442 | 51.8% | |
| 1920 | 4,171 | 21.2% | |
| 1930 | 8,956 | 114.7% | |
| 1940 | 9,799 | 9.4% | |
| 1950 | 9,054 | −7.6% | |
| 1960 | 7,846 | −13.3% | |
| 1970 | 6,697 | −14.6% | |
| 1980 | 9,606 | 43.4% | |
| 1990 | 9,556 | −0.5% | |
| 2000 | 12,309 | 28.8% | |
| 2010 | 11,531 | −6.3% | |
| 2020 | 11,335 | −1.7% | |
| 2023 (est.) | 11,584 | [5] | 2.2% |
| U.S. Decennial Census[6] 1850–2010[7] 2020[8] | |||
Racial and ethnic composition
| Race / Ethnicity (NH = Non-Hispanic) | Pop 2000[9] | Pop 2010[10] | Pop 2020[8] | % 2000 | % 2010 | % 2020 |
|---|---|---|---|---|---|---|
| White alone (NH) | 7,199 | 6,805 | 5,968 | 58.49% | 59.01% | 52.65% |
| Black or African American alone (NH) | 281 | 453 | 205 | 2.28% | 3.93% | 1.81% |
| Native American or Alaska Native alone (NH) | 30 | 62 | 49 | 0.24% | 0.54% | 0.43% |
| Asian alone (NH) | 23 | 56 | 35 | 0.19% | 0.49% | 0.31% |
| Pacific Islander alone (NH) | 2 | 3 | 3 | 0.02% | 0.03% | 0.03% |
| Other race alone (NH) | 4 | 9 | 45 | 0.03% | 0.08% | 0.40% |
| Multiracial (NH) | 87 | 83 | 240 | 0.71% | 0.72% | 2.12% |
| Hispanic or Latino (any race) | 4,683 | 4,060 | 4,790 | 38.05% | 35.21% | 42.26% |
| Total | 12,309 | 11,531 | 11,335 | 100.00% | 100.00% | 100.00% |
2020 census
As of the 2020 census, the county had a population of 11,335. The median age was 44.4 years; 18.0% of residents were under the age of 18 and 21.6% were 65 years of age or older. For every 100 females there were 129.3 males, and for every 100 females age 18 and over there were 133.6 males age 18 and over.[11]
The racial makeup of the county was 74.3% White, 1.9% Black or African American, 0.6% American Indian and Alaska Native, 0.3% Asian, <0.1% Native Hawaiian and Pacific Islander, 6.5% from some other race, and 16.4% from two or more races. Hispanic or Latino residents of any race comprised 42.3% of the population.[12]
<0.1% of residents lived in urban areas, while 100.0% lived in rural areas.[13]
There were 4,067 households in the county, of which 26.0% had children under the age of 18 living in them. Of all households, 50.5% were married-couple households, 21.4% were households with a male householder and no spouse or partner present, and 22.8% were households with a female householder and no spouse or partner present. About 29.1% of all households were made up of individuals and 14.5% had someone living alone who was 65 years of age or older.[11]
There were 5,927 housing units, of which 31.4% were vacant. Among occupied housing units, 79.8% were owner-occupied and 20.2% were renter-occupied. The homeowner vacancy rate was 2.3% and the rental vacancy rate was 24.4%.[11]
2000 census
As of the 2000 census,[14] 12,309 people, 4,230 households, and 3,070 families were residing in the county. The population density was 12 people per square mile (4.6 people/km2). The 6,196 housing units had an average density of 6 units per square mile (2.3/km2). The racial makeup of the county was 87.28% White, 2.45% African American, 0.41% Native American, 0.19% Asian, 7.74% from other races, and 1.94% from two or more races. About 38.05% of the population were Hispanics or Latinos of any race.
Of the 4,230 households, 30.9% had children under 18 living with them, 60.1% were married couples living together, 8.7% had a female householder with no husband present, and 27.4% were not families. About 23.9% of all households were made up of individuals, and 12.4% had someone living alone who was 65 or older. The average household size was 2.53 and the average family size was 3.00.
In the county, the age distribution was 22.3% under 18, 9.5% from 18 to 24, 27.1% from 25 to 44, 25.1% from 45 to 64, and 16.0% who were 65 or older. The median age was 39 years. For every 100 females, there were 122.2 males. For every 100 females 18 and over, there were 129.8 males.
The median income for a household in the county was $32,057 and for a family was $38,235. Males had a median income of $30,061 versus $19,665 for females. The per capita income for the county was $15,886. About 14.1% of families and 16.5% of the population were below the poverty line, including 22.2% of those under 18 and 11.7% of those 65 or over.
Government and infrastructure
The Federal Bureau of Prisons, Federal Correctional Institution, Three Rivers, is located in unincorporated Live Oak County near Three Rivers.[15][16]
Politics
Live Oak County voted predominantly Democratic at the presidential level during the first half of the 20th century. Native son Dwight D. Eisenhower’s 1952 win was an exception. Jimmy Carter in 1976, however, was the last Democratic presidential candidate to carry the county, with Republicans winning since 1980.
| Year | Republican | Democratic | Third party(ies) | |||
|---|---|---|---|---|---|---|
| No. | % | No. | % | No. | % | |
| 1912 | 26 | 6.52% | 308 | 77.19% | 65 | 16.29% |
| 1916 | 119 | 20.73% | 397 | 69.16% | 58 | 10.10% |
| 1920 | 161 | 32.46% | 234 | 47.18% | 101 | 20.36% |
| 1924 | 323 | 31.92% | 596 | 58.89% | 93 | 9.19% |
| 1928 | 484 | 55.82% | 383 | 44.18% | 0 | 0.00% |
| 1932 | 114 | 9.56% | 1,070 | 89.77% | 8 | 0.67% |
| 1936 | 231 | 20.17% | 874 | 76.33% | 40 | 3.49% |
| 1940 | 499 | 35.90% | 888 | 63.88% | 3 | 0.22% |
| 1944 | 548 | 39.00% | 642 | 45.69% | 215 | 15.30% |
| 1948 | 479 | 30.57% | 945 | 60.31% | 143 | 9.13% |
| 1952 | 1,443 | 71.22% | 573 | 28.28% | 10 | 0.49% |
| 1956 | 1,077 | 65.71% | 521 | 31.79% | 41 | 2.50% |
| 1960 | 1,048 | 57.52% | 770 | 42.26% | 4 | 0.22% |
| 1964 | 795 | 35.71% | 1,423 | 63.93% | 8 | 0.36% |
| 1968 | 938 | 40.02% | 922 | 39.33% | 484 | 20.65% |
| 1972 | 1,745 | 73.97% | 610 | 25.86% | 4 | 0.17% |
| 1976 | 1,287 | 43.47% | 1,656 | 55.93% | 18 | 0.61% |
| 1980 | 2,193 | 60.61% | 1,380 | 38.14% | 45 | 1.24% |
| 1984 | 2,481 | 66.00% | 1,260 | 33.52% | 18 | 0.48% |
| 1988 | 2,277 | 58.69% | 1,573 | 40.54% | 30 | 0.77% |
| 1992 | 1,805 | 45.52% | 1,345 | 33.92% | 815 | 20.55% |
| 1996 | 1,929 | 53.41% | 1,372 | 37.98% | 311 | 8.61% |
| 2000 | 2,828 | 70.63% | 1,114 | 27.82% | 62 | 1.55% |
| 2004 | 3,147 | 74.91% | 1,036 | 24.66% | 18 | 0.43% |
| 2008 | 3,095 | 74.11% | 1,048 | 25.10% | 33 | 0.79% |
| 2012 | 3,154 | 76.68% | 919 | 22.34% | 40 | 0.97% |
| 2016 | 3,464 | 80.52% | 742 | 17.25% | 96 | 2.23% |
| 2020 | 4,199 | 83.07% | 819 | 16.20% | 37 | 0.73% |
| 2024 | 4,307 | 84.57% | 761 | 14.94% | 25 | 0.49% |
| Year | Republican | Democratic | Third party(ies) | |||
|---|---|---|---|---|---|---|
| No. | % | No. | % | No. | % | |
| 2024 | 4,165 | 77.78% | 1,115 | 20.82% | 75 | 1.40% |
Communities
Cities
- George West (county seat)
- Three Rivers
Village
- Pernitas Point (small part in Jim Wells County)
Unincorporated communities
Ghost town
Education
School districts include:[19]
- George West Independent School District
- Mathis Independent School District
- Three Rivers Independent School District
Coastal Bend College (formerly Bee County College) is the county's designated community college.[20]
See also
- National Register of Historic Places listings in Live Oak County, Texas
- Recorded Texas Historic Landmarks in Live Oak County
- Live Oak County Courthouse
- Live Oak County Jail
References
- ^ Gannett, Henry (1905). The Origin of Certain Place Names in the United States. U.S. Government Printing Office. p. 188.
- ^ "Find a County". National Association of Counties. Retrieved June 7, 2011.
- ^ "Live Oak County, Texas". United States Census Bureau. Retrieved January 30, 2022.
- ^ "2010 Census Gazetteer Files". United States Census Bureau. August 22, 2012. Retrieved May 3, 2015.
- ^ "2023 Population Estimates (PEP)". United States Census Bureau. Retrieved February 22, 2026.
- ^ "Decennial Census of Population and Housing by Decades". US Census Bureau.
- ^ "Texas Almanac: Population History of Counties from 1850–2010" (PDF). Texas Almanac. Archived (PDF) from the original on October 9, 2022. Retrieved May 3, 2015.
- ^ a b "P2 Hispanic or Latino, and Not Hispanic or Latino by Race – 2020: DEC Redistricting Data (PL 94-171) – Live Oak County, Texas". United States Census Bureau.
- ^ "P004: Hispanic or Latino, and Not Hispanic or Latino by Race – 2000: DEC Summary File 1 – Live Oak County, Texas". United States Census Bureau.
- ^ "P2 Hispanic or Latino, and Not Hispanic or Latino by Race – 2010: DEC Redistricting Data (PL 94-171) – Live Oak County, Texas". United States Census Bureau.
- ^ a b c "2020 Decennial Census Demographic Profile (DP1)". United States Census Bureau. 2021. Retrieved January 10, 2026.
- ^ "2020 Decennial Census Redistricting Data (Public Law 94-171)". United States Census Bureau. 2021. Retrieved January 10, 2026.
- ^ "2020 Decennial Census Demographic and Housing Characteristics (DHC)". United States Census Bureau. 2023. Retrieved January 10, 2026.
- ^ "U.S. Census website". United States Census Bureau. Retrieved May 14, 2011.
- ^ "FCI Three Rivers Contact Information Archived December 3, 2010, at the Wayback Machine." Federal Bureau of Prisons. Retrieved on December 12, 2010. "US HIGHWAY 72 WEST THREE RIVERS, TX 78071"
- ^ "Three Rivers city, Texas[permanent dead link]." U.S. Census Bureau. Retrieved on December 12, 2010.
- ^ Leip, David. "Dave Leip's Atlas of U.S. Presidential Elections". uselectionatlas.org. Retrieved July 26, 2018.
- ^ "2024 Senate Election (Official Returns)". Commonwealth of Texas by county. November 5, 2024. Retrieved December 5, 2024.
- ^ "2020 CENSUS - SCHOOL DISTRICT REFERENCE MAP: Live Oak County, TX" (PDF). U.S. Census Bureau. Retrieved February 15, 2024. - Text list
- ^ Texas Education Code Sec. 130.167. BEE COUNTY COLLEGE DISTRICT SERVICE AREA. The legislation calls it "Bee County College".
External links
- Official website

- Live Oak County from the Handbook of Texas Online
- "Live Oak County Profile" from the Texas Association of Counties
- Index of Landmarks
Places adjacent to Live Oak County, Texas | ||||||||||||||||
|---|---|---|---|---|---|---|---|---|---|---|---|---|---|---|---|---|
| ||||||||||||||||
Municipalities and communities of Live Oak County, Texas, United States | ||
|---|---|---|
| Cities | 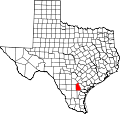 | |
| Unincorporated communities | ||
| Ghost town | ||
| Footnotes | ‡This populated place also has portions in an adjacent county or counties | |
28°21′N 98°08′W / 28.35°N 98.13°W
| International | |
|---|---|
| National | |
| Other | |