


Jackson County, Texas
Jackson County, Texas | |
|---|---|
 The Jackson County Courthouse in Edna | |
 Location within the U.S. state of Texas | |
| Coordinates: 28°56′N 96°35′W / 28.94°N 96.58°W | |
| Country | |
| State | |
| Founded | 1836 |
| Named after | Andrew Jackson |
| Seat | Edna |
| Largest city | Edna |
| Area | |
• Total | 857 sq mi (2,220 km2) |
| • Land | 829 sq mi (2,150 km2) |
| • Water | 27 sq mi (70 km2) 3.2% |
| Population (2020) | |
• Total | 14,988 |
| • Density | 18.1/sq mi (6.98/km2) |
| Time zone | UTC−6 (Central) |
| • Summer (DST) | UTC−5 (CDT) |
| Congressional district | 27th |
| Website | www |


Jackson County is a county in the U.S. state of Texas. As of the 2020 census its population was 14,988.[1] Its county seat is Edna.[2] The county was created in 1835 as a municipality in Mexico and in 1836 was organized as a county (of the Republic of Texas).[3][4] It is named for Andrew Jackson, President of the United States from 1829 to 1837.[5]
Geography
According to the U.S. Census Bureau, the county has a total area of 857 square miles (2,220 km2), of which 829 square miles (2,150 km2) is land and 27 square miles (70 km2) (3.2%) is water.[6]
Major highways
 U.S. Highway 59
 Interstate 69 is currently under construction and will follow the current route of U.S. 59 in most places.
 State Highway 35
 State Highway 111
 State Highway 172
 Farm to Market Road 234
 Farm to Market Road 616
 Farm to Market Road 1862
Adjacent counties
- Colorado County (north)
- Wharton County (northeast)
- Matagorda County (southeast)
- Calhoun County (south)
- Victoria County (southwest)
- Lavaca County (northwest)
Demographics
| Census | Pop. | Note | %± |
|---|---|---|---|
| 1850 | 996 | — | |
| 1860 | 2,612 | 162.2% | |
| 1870 | 2,278 | −12.8% | |
| 1880 | 2,723 | 19.5% | |
| 1890 | 3,281 | 20.5% | |
| 1900 | 6,094 | 85.7% | |
| 1910 | 6,471 | 6.2% | |
| 1920 | 11,244 | 73.8% | |
| 1930 | 10,980 | −2.3% | |
| 1940 | 11,720 | 6.7% | |
| 1950 | 12,916 | 10.2% | |
| 1960 | 14,040 | 8.7% | |
| 1970 | 12,975 | −7.6% | |
| 1980 | 13,352 | 2.9% | |
| 1990 | 13,039 | −2.3% | |
| 2000 | 14,391 | 10.4% | |
| 2010 | 14,075 | −2.2% | |
| 2020 | 14,988 | 6.5% | |
| 2024 (est.) | 15,284 | [7] | 2.0% |
| U.S. Decennial Census[8] 1850–2010[9] 2020[10] | |||
Racial and ethnic composition
| Race / Ethnicity (NH = Non-Hispanic) | Pop 2000[11] | Pop 2010[12] | Pop 2020[10] | % 2000 | % 2010 | % 2020 |
|---|---|---|---|---|---|---|
| White alone (NH) | 9,546 | 8,855 | 8,510 | 66.33% | 62.91% | 56.78% |
| Black or African American alone (NH) | 1,081 | 942 | 937 | 7.51% | 6.69% | 6.25% |
| Native American or Alaska Native alone (NH) | 42 | 35 | 36 | 0.29% | 0.25% | 0.24% |
| Asian alone (NH) | 55 | 50 | 158 | 0.38% | 0.36% | 1.05% |
| Pacific Islander alone (NH) | 6 | 1 | 5 | 0.04% | 0.01% | 0.03% |
| Other race alone (NH) | 0 | 8 | 102 | 0.04% | 0.06% | 0.68% |
| Mixed race or Multiracial (NH) | 104 | 105 | 411 | 0.72% | 0.75% | 2.74% |
| Hispanic or Latino (any race) | 3,551 | 4,079 | 4,829 | 24.68% | 28.98% | 32.22% |
| Total | 14,391 | 14,075 | 14,988 | 100.00% | 100.00% | 100.00% |
2020 census
As of the 2020 census, the county had a population of 14,988. The median age was 40.0 years. 24.3% of residents were under the age of 18 and 19.8% of residents were 65 years of age or older. For every 100 females there were 98.4 males, and for every 100 females age 18 and over there were 97.6 males age 18 and over.[13]
The racial makeup of the county was 65.3% White, 6.7% Black or African American, 0.5% American Indian and Alaska Native, 1.1% Asian, <0.1% Native Hawaiian and Pacific Islander, 12.4% from some other race, and 14.0% from two or more races. Hispanic or Latino residents of any race comprised 32.2% of the population.[14]
39.4% of residents lived in urban areas, while 60.6% lived in rural areas.[15]
There were 5,558 households in the county, of which 33.3% had children under the age of 18 living in them. Of all households, 53.2% were married-couple households, 18.3% were households with a male householder and no spouse or partner present, and 23.8% were households with a female householder and no spouse or partner present. About 24.6% of all households were made up of individuals and 12.1% had someone living alone who was 65 years of age or older.[13]
There were 6,996 housing units, of which 20.6% were vacant. Among occupied housing units, 72.0% were owner-occupied and 28.0% were renter-occupied. The homeowner vacancy rate was 2.7% and the rental vacancy rate was 18.2%.[13]
2000 census
As of the 2000 census, there were 14,391 people, 5,336 households, and 3,889 families residing in the county. The population density was 17 people per square mile (6.6 people/km2). There were 6,545 housing units at an average density of 8 units per square mile (3.1/km2). The racial makeup of the county was 76.49% White, 7.64% Black or African American, 0.39% Native American, 0.39% Asian, 0.06% Pacific Islander, 12.65% from other races, and 2.39% from two or more races. 24.68% of the population were Hispanic or Latino of any race. 17.9% were of German, 10.8% American, 9.3% Czech, 6.0% Irish and 5.6% English ancestry according to Census 2000. 81.6% spoke English and 17.4% Spanish as their first language.[16]
There were 5,336 households, out of which 34.70% had children under the age of 18 living with them, 58.20% were married couples living together, 10.50% had a female householder with no husband present, and 27.10% were non-families. 24.20% of all households were made up of individuals, and 12.50% had someone living alone who was 65 years of age or older. The average household size was 2.65 and the average family size was 3.15.
In the county, the population was spread out, with 27.40% under the age of 18, 8.20% from 18 to 24, 26.10% from 25 to 44, 22.30% from 45 to 64, and 15.90% who were 65 years of age or older. The median age was 37 years. For every 100 females there were 96.70 males. For every 100 females age 18 and over, there were 93.40 males.
The median income for a household in the county was $35,254, and the median income for a family was $42,066. Males had a median income of $32,639 versus $19,661 for females. The per capita income for the county was $16,693. About 12.20% of families and 14.70% of the population were below the poverty line, including 19.10% of those under age 18 and 15.60% of those age 65 or over.
Communities
Cities
Census-designated places
Unincorporated communities
Ghost town
Politics
Jackson County has voted Republican in every presidential election since 1980, often by landslide margins.
| Year | Republican | Democratic | Third party(ies) | |||
|---|---|---|---|---|---|---|
| No. | % | No. | % | No. | % | |
| 1912 | 35 | 6.59% | 323 | 60.83% | 173 | 32.58% |
| 1916 | 123 | 20.71% | 403 | 67.85% | 68 | 11.45% |
| 1920 | 355 | 33.65% | 562 | 53.27% | 138 | 13.08% |
| 1924 | 354 | 30.28% | 758 | 64.84% | 57 | 4.88% |
| 1928 | 572 | 54.68% | 473 | 45.22% | 1 | 0.10% |
| 1932 | 182 | 14.99% | 1,030 | 84.84% | 2 | 0.16% |
| 1936 | 171 | 15.16% | 952 | 84.40% | 5 | 0.44% |
| 1940 | 296 | 16.41% | 1,506 | 83.48% | 2 | 0.11% |
| 1944 | 344 | 14.98% | 1,708 | 74.39% | 244 | 10.63% |
| 1948 | 488 | 24.75% | 1,343 | 68.10% | 141 | 7.15% |
| 1952 | 2,113 | 57.14% | 1,584 | 42.83% | 1 | 0.03% |
| 1956 | 2,259 | 58.64% | 1,571 | 40.78% | 22 | 0.57% |
| 1960 | 1,670 | 42.04% | 2,268 | 57.10% | 34 | 0.86% |
| 1964 | 1,168 | 29.55% | 2,775 | 70.22% | 9 | 0.23% |
| 1968 | 1,438 | 33.55% | 1,698 | 39.62% | 1,150 | 26.83% |
| 1972 | 2,743 | 69.81% | 1,163 | 29.60% | 23 | 0.59% |
| 1976 | 1,884 | 42.50% | 2,524 | 56.94% | 25 | 0.56% |
| 1980 | 2,540 | 56.91% | 1,826 | 40.91% | 97 | 2.17% |
| 1984 | 3,661 | 66.83% | 1,804 | 32.93% | 13 | 0.24% |
| 1988 | 2,954 | 57.75% | 2,141 | 41.86% | 20 | 0.39% |
| 1992 | 2,451 | 47.57% | 1,722 | 33.42% | 979 | 19.00% |
| 1996 | 2,533 | 54.59% | 1,785 | 38.47% | 322 | 6.94% |
| 2000 | 3,365 | 69.30% | 1,446 | 29.78% | 45 | 0.93% |
| 2004 | 3,766 | 74.18% | 1,296 | 25.53% | 15 | 0.30% |
| 2008 | 3,723 | 73.46% | 1,301 | 25.67% | 44 | 0.87% |
| 2012 | 3,906 | 77.73% | 1,070 | 21.29% | 49 | 0.98% |
| 2016 | 4,266 | 80.46% | 904 | 17.05% | 132 | 2.49% |
| 2020 | 5,231 | 82.34% | 1,033 | 16.26% | 89 | 1.40% |
| 2024 | 5,386 | 85.10% | 907 | 14.33% | 36 | 0.57% |
| Year | Republican | Democratic | Third party(ies) | |||
|---|---|---|---|---|---|---|
| No. | % | No. | % | No. | % | |
| 2024 | 5,222 | 82.89% | 998 | 15.84% | 80 | 1.27% |
Education
School districts include:[19]
- Edna Independent School District
- Ganado Independent School District
- Hallettsville Independent School District
- Industrial Independent School District
- Palacios Independent School District
Residents of the county not in Ganado ISD are in the service area of Victoria College. Residents of the Ganado ISD part are in the service area of Wharton County Junior College.[20]
See also
- List of museums in the Texas Gulf Coast
- National Register of Historic Places listings in Jackson County, Texas
- Recorded Texas Historic Landmarks in Jackson County
References
- ^ "Jackson County, Texas". United States Census Bureau. Retrieved January 30, 2022.
- ^ "Find a County". National Association of Counties. Archived from the original on May 31, 2011. Retrieved June 7, 2011.
- ^ "Texas: Individual County Chronologies". Texas Atlas of Historical County Boundaries. The Newberry Library. 2008. Archived from the original on April 12, 2017. Retrieved June 20, 2015.
- ^ "Jackson County". Texas Almanac. Texas State Historical Association. Retrieved June 20, 2015.
- ^ Gannett, Henry (1905). The Origin of Certain Place Names in the United States. Govt. Print. Off. pp. 167.
- ^ "2010 Census Gazetteer Files". United States Census Bureau. August 22, 2012. Retrieved May 2, 2015.
- ^ {{cite web
 |url=https://www.census.gov/quickfacts/fact/table/jacksoncountytexas/PST045224
|title=QuickFacts: Jackson County, Texas
|publisher=United States Census Bureau
|access-date=June 15, 2025}}
|url=https://www.census.gov/quickfacts/fact/table/jacksoncountytexas/PST045224
|title=QuickFacts: Jackson County, Texas
|publisher=United States Census Bureau
|access-date=June 15, 2025}}
- ^ "Decennial Census of Population and Housing by Decades". US Census Bureau.
- ^ "Texas Almanac: Population History of Counties from 1850–2010" (PDF). Texas Almanac. Archived (PDF) from the original on October 9, 2022. Retrieved May 2, 2015.
- ^ a b "P2 Hispanic or Latino, and Not Hispanic or Latino by Race – 2020: DEC Redistricting Data (PL 94-171) – Jackson County, Texas". United States Census Bureau.
- ^ "P004: Hispanic or Latino, and Not Hispanic or Latino by Race – 2000: DEC Summary File 1 – Jackson County, Texas". United States Census Bureau.
- ^ "P2 Hispanic or Latino, and Not Hispanic or Latino by Race – 2010: DEC Redistricting Data (PL 94-171) – Jackson County, Texas". United States Census Bureau.
- ^ a b c "2020 Decennial Census Demographic Profile (DP1)". United States Census Bureau. 2021. Retrieved January 10, 2026.
- ^ "2020 Decennial Census Redistricting Data (Public Law 94-171)". United States Census Bureau. 2021. Retrieved January 10, 2026.
- ^ "2020 Decennial Census Demographic and Housing Characteristics (DHC)". United States Census Bureau. 2023. Retrieved January 10, 2026.
- ^ "U.S. Census website". United States Census Bureau. Retrieved May 14, 2011.
- ^ Leip, David. "Dave Leip's Atlas of U.S. Presidential Elections". uselectionatlas.org. Retrieved July 25, 2018.
- ^ "2024 Senate Election (Official Returns)". Commonwealth of Texas by county. November 5, 2024. Retrieved December 5, 2024.
- ^ "2020 CENSUS - SCHOOL DISTRICT REFERENCE MAP: Jackson County, TX" (PDF). U.S. Census Bureau. Retrieved November 29, 2024. - Text list
- ^ Texas Education Code Sec. 130.208. THE VICTORIA COLLEGE DISTRICT SERVICE AREA. Sec. 130.211. WHARTON COUNTY JUNIOR COLLEGE DISTRICT SERVICE AREA.
External links
- Official website

- Jackson County from the Handbook of Texas Online
- Danish Heritage Preservation Society
- "Jackson County Profile" from the Texas Association of Counties Archived September 15, 2015, at the Wayback Machine
Places adjacent to Jackson County, Texas | ||||||||||||||||
|---|---|---|---|---|---|---|---|---|---|---|---|---|---|---|---|---|
| ||||||||||||||||
Municipalities and communities of Jackson County, Texas, United States | ||
|---|---|---|
| Cities | 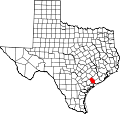 | |
| CDPs | ||
| Other communities | ||
| Ghost town | ||
28°56′N 96°35′W / 28.94°N 96.58°W
| International | |
|---|---|
| National | |
| Other | |