


Gray County, Texas
Gray County, Texas | |
|---|---|
.JPG) The Gray County Courthouse | |
 Location within the U.S. state of Texas | |
| Coordinates: 35°25′N 100°49′W / 35.41°N 100.81°W | |
| Country | |
| State | |
| Founded | 1902 |
| Named after | Peter W. Gray |
| Seat | Pampa |
| Largest city | Pampa |
| Area | |
• Total | 929 sq mi (2,410 km2) |
| • Land | 926 sq mi (2,400 km2) |
| • Water | 3.4 sq mi (8.8 km2) 0.4% |
| Population (2020) | |
• Total | 21,227 |
| • Density | 23/sq mi (8.9/km2) |
| Time zone | UTC−6 (Central) |
| • Summer (DST) | UTC−5 (CDT) |
| Congressional district | 13th |
| Website | www |
Gray County is a county located in the U.S. state of Texas. As of the 2020 census, its population was 21,227.[1] The county seat is Pampa.[2] The county was created in 1876 and later organized in 1902.[3] Gray County is named for Peter W. Gray,[4] a Confederate lawyer and soldier in the American Civil War. Gray County comprises the Pampa, TX micropolitan statistical area.
Geography
According to the U.S. Census Bureau, the county has a total area of 929 square miles (2,410 km2), of which 926 sq mi (2,400 km2) are land and 3.4 sq mi (8.8 km2) (0.4%) are covered by water.[5]
Major highways
Adjacent counties
- Roberts County (north)
- Hemphill County (northeast)
- Wheeler County (east)
- Collingsworth County (southeast)
- Donley County (south)
- Armstrong County (southwest)
- Carson County (west)
National protected area
Demographics
| Census | Pop. | Note | %± |
|---|---|---|---|
| 1880 | 56 | — | |
| 1890 | 203 | 262.5% | |
| 1900 | 480 | 136.5% | |
| 1910 | 3,405 | 609.4% | |
| 1920 | 4,663 | 36.9% | |
| 1930 | 22,090 | 373.7% | |
| 1940 | 23,911 | 8.2% | |
| 1950 | 24,728 | 3.4% | |
| 1960 | 31,535 | 27.5% | |
| 1970 | 26,949 | −14.5% | |
| 1980 | 26,386 | −2.1% | |
| 1990 | 23,967 | −9.2% | |
| 2000 | 22,744 | −5.1% | |
| 2010 | 22,535 | −0.9% | |
| 2020 | 21,227 | −5.8% | |
| 2024 (est.) | 20,888 | −1.6% | |
| U.S. Decennial Census[7] 1850–1900[8] 1910[9] 1920[10] 1930[11] 1940[12] 1950[13] 1960[14] 1970[15] 1980[16] 1990[17] 2000[18] 2010[19] 2020[20] | |||
Racial and ethnic composition
| Race / Ethnicity (NH = Non-Hispanic) | Pop 2000[21] | Pop 2010[22] | Pop 2020[20] | % 2000 | % 2010 | % 2020 |
|---|---|---|---|---|---|---|
| White alone (NH) | 17,800 | 15,564 | 13,025 | 78.26% | 69.07% | 61.36% |
| Black or African American alone (NH) | 1,309 | 1,055 | 835 | 5.76% | 4.68% | 3.93% |
| Native American or Alaska Native alone (NH) | 169 | 152 | 141 | 0.74% | 0.67% | 0.66% |
| Asian alone (NH) | 88 | 83 | 127 | 0.39% | 0.37% | 0.60% |
| Pacific Islander alone (NH) | 4 | 1 | 0 | 0.02% | 0.00% | 0.00% |
| Other race alone (NH) | 18 | 11 | 37 | 0.08% | 0.05% | 0.17% |
| Mixed race or Multiracial (NH) | 397 | 304 | 715 | 1.75% | 1.35% | 3.37% |
| Hispanic or Latino (any race) | 2,959 | 5,365 | 6,347 | 13.01% | 23.81% | 29.90% |
| Total | 22,744 | 22,535 | 21,227 | 100.00% | 100.00% | 100.00% |
2020 census
As of the 2020 census, the county had a population of 21,227. The median age was 39.2 years. 24.1% of residents were under the age of 18 and 17.5% of residents were 65 years of age or older. For every 100 females there were 111.1 males, and for every 100 females age 18 and over there were 111.7 males age 18 and over.[23][24]
The racial makeup of the county was 68.9% White, 4.1% Black or African American, 1.0% American Indian and Alaska Native, 0.6% Asian, <0.1% Native Hawaiian and Pacific Islander, 12.6% from some other race, and 12.8% from two or more races. Hispanic or Latino residents of any race comprised 29.9% of the population.[24]
79.5% of residents lived in urban areas, while 20.5% lived in rural areas.[25]
There were 7,939 households in the county, of which 33.0% had children under the age of 18 living in them. Of all households, 49.9% were married-couple households, 18.9% were households with a male householder and no spouse or partner present, and 26.4% were households with a female householder and no spouse or partner present. About 29.1% of all households were made up of individuals and 14.1% had someone living alone who was 65 years of age or older.[23]
There were 9,996 housing units, of which 20.6% were vacant. Among occupied housing units, 73.0% were owner-occupied and 27.0% were renter-occupied. The homeowner vacancy rate was 3.4% and the rental vacancy rate was 19.6%.[23]
2000 census
As of the 2000 census, 22,744 people, 8,793 households, and 6,049 families were residing in the county.[26] The population density was 24 people per square mile (9.3 people/km2). The 10,567 housing units averaged 11 units per square mile (4.2/km2). The racial makeup of the county was 82.15% White, 5.85% African American, 0.94% Native American, 0.39% Asian, 8.25% from other races, and 2.42% from two or more races. About 13.01% of the population was Hispanic or Latino of any race.
Of the 8,793 households, 30.00% had children under the age of 18 living with them, 57.00% were married couples living together, 9.00% had a female householder with no husband present, and 31.20% were not families. About 28.70% of all households were made up of individuals, and 15.30% had someone living alone who was 65 years of age or older. The average household size was 2.39, and the average family size was 2.93.
In the county, the age distribution was 24.00% under 18, 8.40% from 18 to 24, 27.20% from 25 to 44, 22.30% from 45 to 64, and 18.10% who were 65 or older. The median age was 39 years. For every 100 females, there were 104.00 males. For every 100 females age 18 and over, there were 103.70 males.
The median income for a household in the county was $31,368, and for a family was $40,019. Males had a median income of $32,401 versus $20,158 for females. The per capita income for the county was $16,702. About 11.20% of families and 13.80% of the population were below the poverty line, including 17.60% of those under age 18 and 9.60% of those age 65 or over.
Communities
City
- Pampa (county seat)
Towns
Other unincorporated communities
Politics
Prior to 1952, Gray County was primarily Democratic similar to most of Texas and the Solid South. The county only gave a Republican presidential candidate a majority before 1952 in 1928, when Herbert Hoover won the county due to anti-Catholic sentiment towards Al Smith. Starting with the 1952 election, the county has become a Republican stronghold along with the rest of the Texas Panhandle. This level of Republican dominance has increased in recent years, as every Republican presidential candidate in the second millennium has racked up 80% of the county's vote. Additionally, after the 2008 election, Democrats Barack Obama, Hillary Clinton, and Joe Biden have failed to win even 1,000 votes total in the county.
| Year | Republican | Democratic | Third party(ies) | |||
|---|---|---|---|---|---|---|
| No. | % | No. | % | No. | % | |
| 1912 | 13 | 3.09% | 272 | 64.61% | 136 | 32.30% |
| 1916 | 69 | 11.73% | 482 | 81.97% | 37 | 6.29% |
| 1920 | 251 | 30.95% | 529 | 65.23% | 31 | 3.82% |
| 1924 | 581 | 48.86% | 608 | 51.14% | 0 | 0.00% |
| 1928 | 1,871 | 65.35% | 986 | 34.44% | 6 | 0.21% |
| 1932 | 505 | 12.70% | 3,446 | 86.69% | 24 | 0.60% |
| 1936 | 464 | 9.59% | 4,347 | 89.83% | 28 | 0.58% |
| 1940 | 1,217 | 21.97% | 4,315 | 77.89% | 8 | 0.14% |
| 1944 | 1,739 | 34.86% | 3,067 | 61.48% | 183 | 3.67% |
| 1948 | 1,594 | 27.98% | 3,699 | 64.94% | 403 | 7.08% |
| 1952 | 5,467 | 61.73% | 3,367 | 38.02% | 23 | 0.26% |
| 1956 | 5,047 | 61.90% | 3,034 | 37.21% | 72 | 0.88% |
| 1960 | 6,197 | 68.76% | 2,802 | 31.09% | 14 | 0.16% |
| 1964 | 5,011 | 57.93% | 3,633 | 42.00% | 6 | 0.07% |
| 1968 | 5,994 | 55.53% | 2,374 | 21.99% | 2,427 | 22.48% |
| 1972 | 7,968 | 84.37% | 1,367 | 14.47% | 109 | 1.15% |
| 1976 | 6,010 | 60.33% | 3,872 | 38.87% | 80 | 0.80% |
| 1980 | 7,187 | 70.81% | 2,786 | 27.45% | 176 | 1.73% |
| 1984 | 8,955 | 81.50% | 2,003 | 18.23% | 30 | 0.27% |
| 1988 | 7,259 | 74.22% | 2,460 | 25.15% | 62 | 0.63% |
| 1992 | 6,105 | 58.86% | 2,426 | 23.39% | 1,841 | 17.75% |
| 1996 | 6,102 | 69.15% | 2,114 | 23.96% | 608 | 6.89% |
| 2000 | 6,732 | 82.25% | 1,376 | 16.81% | 77 | 0.94% |
| 2004 | 7,260 | 84.69% | 1,289 | 15.04% | 23 | 0.27% |
| 2008 | 6,924 | 85.13% | 1,153 | 14.18% | 56 | 0.69% |
| 2012 | 6,443 | 87.20% | 886 | 11.99% | 60 | 0.81% |
| 2016 | 6,500 | 87.78% | 701 | 9.47% | 204 | 2.75% |
| 2020 | 6,840 | 87.90% | 829 | 10.65% | 113 | 1.45% |
| 2024 | 6,691 | 88.27% | 845 | 11.15% | 44 | 0.58% |
| Year | Republican | Democratic | Third party(ies) | |||
|---|---|---|---|---|---|---|
| No. | % | No. | % | No. | % | |
| 2024 | 6,489 | 86.29% | 878 | 11.68% | 153 | 2.03% |
Education
School districts include:[29]
- Fort Elliott Consolidated Independent School District
- Grandview-Hopkins Independent School District
- Groom Independent School District
- Lefors Independent School District
- McLean Independent School District
- Miami Independent School District
- Pampa Independent School District
- Wheeler Independent School District
- White Deer Independent School District
According to state law, all of the county is in the service area of Clarendon College.[30]
Notable people
- Phil Cates, state representative from 1971 to 1979, was born in Pampa in 1947.[31]
- Tom Mechler, state Republican Party chairman since 2015, is a former Gray County Republican chairman.
- Kae T. Patrick, a native of Gray County, served in the Texas House of Representatives from San Antonio from 1981 to 1988.
- Trae Young, NBA player, was raised in Pampa while his father played pro-basketball overseas.
See also
- List of museums in the Texas Panhandle
- National Register of Historic Places listings in Gray County, Texas
- Recorded Texas Historic Landmarks in Gray County
References
- ^ "Gray County, Texas". United States Census Bureau. Retrieved January 30, 2022.
- ^ "Find a County". National Association of Counties. Archived from the original on May 31, 2011. Retrieved June 7, 2011.
- ^ "Texas: Individual County Chronologies". Texas Atlas of Historical County Boundaries. The Newberry Library. 2008. Archived from the original on April 12, 2017. Retrieved May 23, 2015.
- ^ Gannett, Henry (1905). The Origin of Certain Place Names in the United States. Govt. Print. Off. pp. 142.
- ^ "2010 Census Gazetteer Files". United States Census Bureau. August 22, 2012. Retrieved April 27, 2015.
- ^ "QuickFacts: Gray County, Texas". United States Census Bureau. Retrieved June 15, 2025.
- ^ "Decennial Census by Decade". US Census Bureau.
- ^ "1900 Census of Population - Population of Texas By Counties And Minor Civil Divisions" (PDF). United States Census Bureau.
- ^ "1910 Census of Population - Supplement for Texas" (PDF). United States Census Bureau.
- ^ "1920 Census of Population - Number of Inhabitants - Texas" (PDF). United States Census Bureau.
- ^ "1930 Census of Population - Number of Inhabitants - Texas" (PDF). United States Census Bureau.
- ^ "1940 Census of Population - Number of Inhabitants - Texas" (PDF). United States Census Bureau.
- ^ "1950 Census of Population - Number of Inhabitants - Texas" (PDF). United States Census Bureau.
- ^ "1960 Census of Population - Number of Inhabitants - Texas" (PDF). United States Census Bureau.
- ^ "1970 Census of Population - Number of Inhabitants - Texas" (PDF). United States Census Bureau.
- ^ "1980 Census of Population - Number of Inhabitants - Texas" (PDF). United States Census Bureau.
- ^ "1990 Census of Population - Population and Housing Unit Counts - Texas" (PDF). United States Census Bureau.
- ^ "2000 Census of Population - Population and Housing Unit Counts - Texas" (PDF). United States Census Bureau.
- ^ "2010 Census of Population - Population and Housing Unit Counts - Texas" (PDF). United States Census Bureau.
- ^ a b "P2 Hispanic or Latino, and Not Hispanic or Latino by Race – 2020: DEC Redistricting Data (PL 94-171) – Gray County, Texas". United States Census Bureau.
- ^ "P004: Hispanic or Latino, and Not Hispanic or Latino by Race – 2000: DEC Summary File 1 – Gray County, Texas". United States Census Bureau.
- ^ "P2 Hispanic or Latino, and Not Hispanic or Latino by Race – 2010: DEC Redistricting Data (PL 94-171) – Gray County, Texas". United States Census Bureau.
- ^ a b c "2020 Decennial Census Demographic Profile (DP1)". United States Census Bureau. 2021. Retrieved January 9, 2026.
- ^ a b "2020 Decennial Census Redistricting Data (Public Law 94-171)". United States Census Bureau. 2021. Retrieved January 9, 2026.
- ^ "2020 Decennial Census Demographic and Housing Characteristics (DHC)". United States Census Bureau. 2023. Retrieved January 9, 2026.
- ^ "U.S. Census website". United States Census Bureau. Retrieved May 14, 2011.
- ^ Leip, David. "Dave Leip's Atlas of U.S. Presidential Elections". uselectionatlas.org. Retrieved April 10, 2018.
- ^ "2024 Senate Election (Official Returns)". Commonwealth of Texas by county. November 5, 2024. Retrieved December 5, 2024.
- ^ Geography Division (December 22, 2020). 2020 Census - School District Reference Map: Gray County, TX (PDF) (Map). U.S. Census Bureau. Retrieved October 10, 2025. - Text list
- ^ Texas Education Code, Sec. 130.173. Clarendon College District Service Area.
- ^ "Phil Cates". Texas Legislative Reference Library. Retrieved June 29, 2015.
External links
- Official website

- Gray County from the Handbook of Texas Online
- Gray County Profile from the Texas Association of Counties Archived September 15, 2015, at the Wayback Machine
Places adjacent to Gray County, Texas | ||||||||||||||||
|---|---|---|---|---|---|---|---|---|---|---|---|---|---|---|---|---|
| ||||||||||||||||
Municipalities and communities of Gray County, Texas, United States | ||
|---|---|---|
| City | 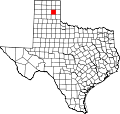 | |
| Towns | ||
| CDP | ||
| Unincorporated communities | ||
| International | |
|---|---|
| National | |
| Other | |