


Size of this PNG preview of this SVG file: 600 × 400 pixels. Other resolutions: 320 × 213 pixels | 640 × 427 pixels | 1,024 × 683 pixels | 1,280 × 853 pixels | 2,560 × 1,707 pixels.
Original file (SVG file, nominally 600 × 400 pixels, file size: 39 KB)
Summary
| Description |
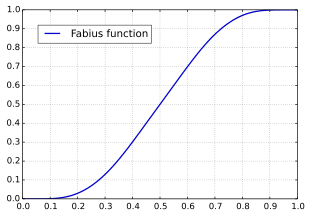
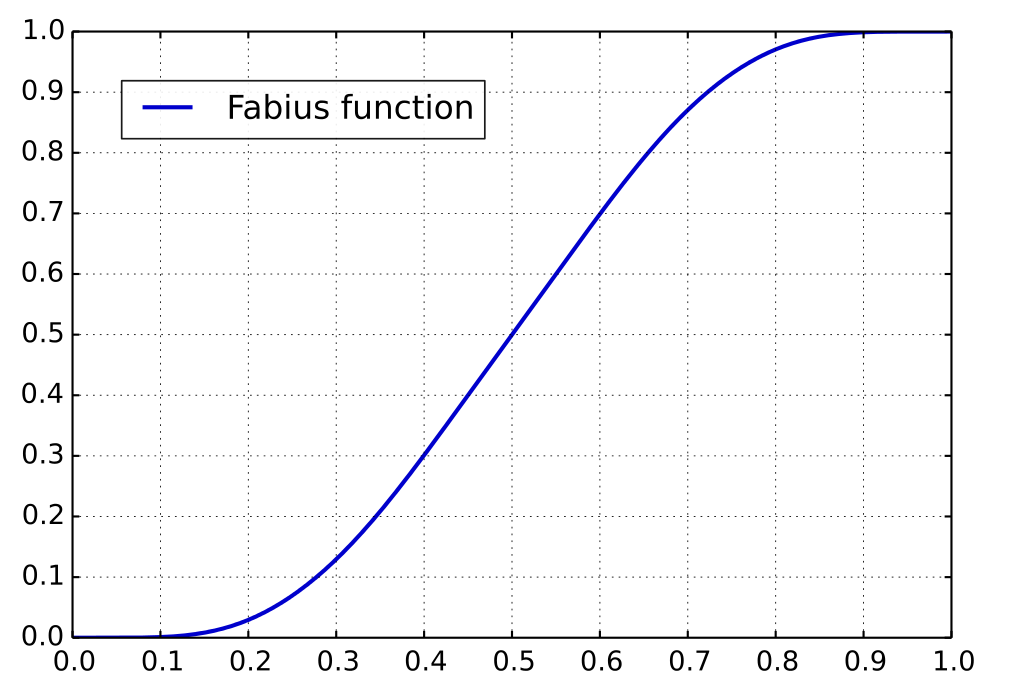
English: Plot of the Fabius function in the interval [0, 1]: The Fabius function is defined on the unit interval, and is given by the probability distribution of |
| Date | |
| Source | Own work |
| Author | Geek3 |
| SVG development | This plot was created with mplwp, the Matplotlib extension for Wikipedia plots. |
| Source code | Python code#!/usr/bin/python
# -*- coding: utf8 -*-
mplwp.postprocess(name)
|

Licensing
I, the copyright holder of this work, hereby publish it under the following licenses:

|
Permission is granted to copy, distribute and/or modify this document under the terms of the GNU Free Documentation License, Version 1.2 or any later version published by the Free Software Foundation; with no Invariant Sections, no Front-Cover Texts, and no Back-Cover Texts. A copy of the license is included in the section entitled GNU Free Documentation License. |
This file is licensed under the Creative Commons Attribution 3.0 Unported license.
- You are free:
- to share – to copy, distribute and transmit the work
- to remix – to adapt the work
- Under the following conditions:
- attribution – You must give appropriate credit, provide a link to the license, and indicate if changes were made. You may do so in any reasonable manner, but not in any way that suggests the licensor endorses you or your use.
You may select the license of your choice.
File history
Click on a date/time to view the file as it appeared at that time.
| Date/Time | Thumbnail | Dimensions | User | Comment | |
|---|---|---|---|---|---|
| current | 13:10, 4 April 2015 | | 600 × 400 (39 KB) | Geek3 | Fabius_function plot by Geek3 |
File usage
The following page uses this file:
Global file usage
The following other wikis use this file:
- Usage on fr.wikipedia.org
- Usage on ko.wikipedia.org
- Usage on ru.wikipedia.org
You must be logged in to post a comment.