


")


Rūjiena (ⓘ; German: Rujen; Estonian: Ruhja) is a town in Valmiera Municipality, in the Vidzeme region of Latvia. As of 2017 its population was 3,007.[3]
Geography
The town is located in northern Latvia, near the border with Estonia, in the historical region of Vidzeme (anciently part of Livonia). It is 50 km (31 mi) from Valmiera, 91 km (57 mi) from Pärnu and 152 km (94 mi) from Riga.
Climate
Rūjiena has a humid continental climate (Köppen Dfb).
| Climate data for Rūjiena (1991-2020 normals, extremes 1940-present) | |||||||||||||
|---|---|---|---|---|---|---|---|---|---|---|---|---|---|
| Month | Jan | Feb | Mar | Apr | May | Jun | Jul | Aug | Sep | Oct | Nov | Dec | Year |
| Record high °C (°F) | 9.7 (49.5) |
10.7 (51.3) |
18.1 (64.6) |
26.4 (79.5) |
29.9 (85.8) |
32.5 (90.5) |
34.4 (93.9) |
35.6 (96.1) |
29.0 (84.2) |
21.3 (70.3) |
14.0 (57.2) |
11.6 (52.9) |
35.6 (96.1) |
| Mean daily maximum °C (°F) | −1.5 (29.3) |
−1.3 (29.7) |
3.3 (37.9) |
11.0 (51.8) |
16.9 (62.4) |
20.4 (68.7) |
23.1 (73.6) |
21.8 (71.2) |
16.4 (61.5) |
9.4 (48.9) |
3.4 (38.1) |
0.0 (32.0) |
10.2 (50.4) |
| Daily mean °C (°F) | −3.8 (25.2) |
−4.2 (24.4) |
−0.4 (31.3) |
5.9 (42.6) |
11.5 (52.7) |
15.3 (59.5) |
17.8 (64.0) |
16.6 (61.9) |
11.7 (53.1) |
6.0 (42.8) |
1.4 (34.5) |
−1.9 (28.6) |
6.3 (43.4) |
| Mean daily minimum °C (°F) | −6.5 (20.3) |
−7.3 (18.9) |
−4.1 (24.6) |
0.9 (33.6) |
5.3 (41.5) |
9.5 (49.1) |
12.2 (54.0) |
11.3 (52.3) |
7.2 (45.0) |
2.7 (36.9) |
−1.0 (30.2) |
−4.3 (24.3) |
2.2 (35.9) |
| Record low °C (°F) | −42.2 (−44.0) |
−38.7 (−37.7) |
−30.2 (−22.4) |
−18.5 (−1.3) |
−6.5 (20.3) |
−1.1 (30.0) |
2.8 (37.0) |
1.0 (33.8) |
−5.8 (21.6) |
−13.9 (7.0) |
−21.3 (−6.3) |
−39.2 (−38.6) |
−42.2 (−44.0) |
| Average precipitation mm (inches) | 51.3 (2.02) |
39.7 (1.56) |
36.2 (1.43) |
38.8 (1.53) |
50.4 (1.98) |
80.6 (3.17) |
71.2 (2.80) |
80.8 (3.18) |
56.0 (2.20) |
77.7 (3.06) |
59.7 (2.35) |
52.6 (2.07) |
695 (27.35) |
| Average precipitation days (≥ 1 mm) | 12 | 9 | 10 | 7 | 8 | 10 | 10 | 11 | 11 | 12 | 12 | 12 | 124 |
| Source 1: LVĢMC[4][5] | |||||||||||||
| Source 2: NOAA (precipitation days 1981-2010)[6] | |||||||||||||
Demographics
In 2021, the town had 2,725 inhabitants, 95% of whom were Latvians.[7]
Population changes
| Year | Pop. | ±% |
|---|---|---|
| 1881 | 1,709 | — |
| 1897 | 2,946 | +72.4% |
| 1925 | 4,830 | +64.0% |
| 1935 | 4,337 | −10.2% |
| 1943 | 4,001 | −7.7% |
| 1959 | 3,507 | −12.3% |
| 1979 | 3,804 | +8.5% |
| 1989 | 3,987 | +4.8% |
| 1997 | 3,849 | −3.5% |
| 2011 | 3,342 | −13.2% |
| 2017 | 2,952 | −11.7% |
| Source: Latvian Geospatial Information Agency | ||
Ethnicities
| Year | Population | Latvians | Russians | Belarusians | Ukrainians | Poles | Lithuanians | Others[8] |
|---|---|---|---|---|---|---|---|---|
| 2000 | 3721 | 3543 | 95 | 17 | 24 | 17 | 7 | 18 |
| 2021 | 2683 | 2558 | 61 | 13 | 18 | 11 | 3 | 19 |
Personalities
- Arturs Alberings (1876–1934), Prime Minister of Latvia from 7 May 1926 to 18 December 1926
- Dāvis Bertāns, basketball player, 1992
- Gustav Klutsis (1895–1938), constructivist photographer and graphic designer
- Kārlis Pētersons (1903 – possibly in 1980), wrestler
- Moses Wolf Goldberg (1905–1964), chemist
- Edvīns Bietags (1908–1983), wrestler
- Nehemiah Levanon (1915–2003), Israeli official
Gallery
-
 Town hall's tower
 -
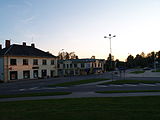 Town's center
 -
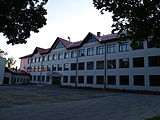 Rūjiena secondary school


See also
References
- ^ "Reģionu, novadu, pilsētu un pagastu kopējā un sauszemes platība gada sākumā". Central Statistical Bureau of Latvia. Retrieved 7 January 2025.
- ^ "Iedzīvotāju skaits pēc tautības reģionos, pilsētās, novados, pagastos, apkaimēs un blīvi apdzīvotās teritorijās gada sākumā (pēc administratīvi teritoriālās reformas 2021. gadā)". Central Statistical Bureau of Latvia. Retrieved 19 June 2024.
- ^ (in Latvian) Latvian population statistics of 2010
- ^ "Klimatisko normu dati". Latvian Environment, Geology and Meteorology Centre. Retrieved March 25, 2023.
- ^ "Gaisa temperatūras rekordi". Latvian Environment, Geology and Meteorology Centre. Retrieved March 25, 2023.
- ^ "World Meteorological Organization Climate Normals for 1981-2010". National Oceanic and Atmospheric Administration. Retrieved April 4, 2023.
- ^ "Valmieras novads. Rūjienas pilsēta". Central Statistical Bureau of Latvia. 2023-03-25. Retrieved 2023-03-25.
- ^ "Iedzīvotāju skaits pēc tautības reģionos, novados, pilsētās, pagastos (atbilstoši robežām 2023. gada sākumā), apkaimēs un blīvi apdzīvotās teritorijās (eksperimentālā statistika) 2000 - 2022". Central Statistical Bureau of Latvia. 2023-03-25. Retrieved 2023-03-25.
External links
 Media related to Rūjiena at Wikimedia Commons
- (in Latvian) Official website of Rūjiena
| Towns | |
|---|---|
| Parishes | |
| International | |
|---|---|
| National | |


You must be logged in to post a comment.