


No higher resolution available.
Hemispheric_14C_graphs_1950s_to_2010.png (598 × 505 pixels, file size: 22 KB, MIME type: image/png)

|
This graph image could be re-created using vector graphics as an SVG file. This has several advantages; see Commons:Media for cleanup for more information. If an SVG form of this image is available, please upload it and afterwards replace this template with
{{vector version available|new image name}}.
It is recommended to name the SVG file “Hemispheric 14C graphs 1950s to 2010.svg”—then the template Vector version available (or Vva) does not need the new image name parameter. |
Summary
| Description |
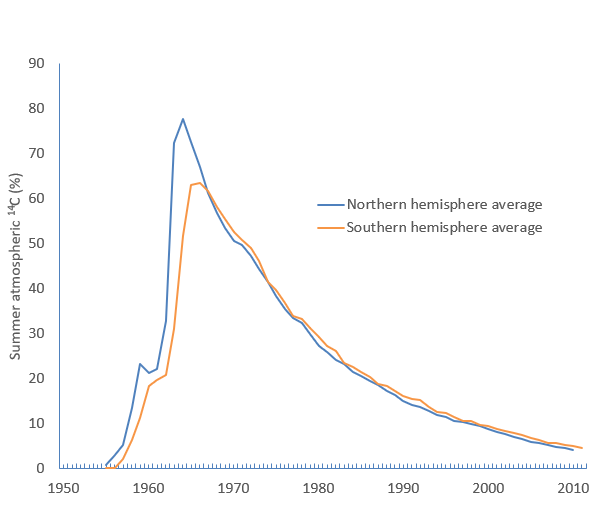
English: Graph of the level of atmospheric carbon from the 1950s to c. 2010. The percentages are % excess over the pre-1950 value. |
| Date | |
| Source |
Own work using:
|
| Author | Mike Christie |
Licensing
I, the copyright holder of this work, hereby publish it under the following license:
This file is licensed under the Creative Commons Attribution-Share Alike 4.0 International license.
- You are free:
- to share – to copy, distribute and transmit the work
- to remix – to adapt the work
- Under the following conditions:
- attribution – You must give appropriate credit, provide a link to the license, and indicate if changes were made. You may do so in any reasonable manner, but not in any way that suggests the licensor endorses you or your use.
- share alike – If you remix, transform, or build upon the material, you must distribute your contributions under the same or compatible license as the original.
File history
Click on a date/time to view the file as it appeared at that time.
| Date/Time | Thumbnail | Dimensions | User | Comment | |
|---|---|---|---|---|---|
| current | 23:52, 7 May 2018 | | 598 × 505 (22 KB) | Mike Christie | Increased font size |
| 22:39, 7 May 2018 |  | 593 × 506 (21 KB) | Mike Christie | User created page with UploadWizard |
File usage
The following 2 pages use this file:
Global file usage
The following other wikis use this file:
- Usage on en.wikiversity.org
- Usage on ja.wikipedia.org
- Usage on www.wikidata.org