


Peoria County, Illinois
Peoria County, Illinois | |
|---|---|
 Peoria County Courthouse | |
 Flag  Seal | |
 Location within the U.S. state of Illinois | |
| Coordinates: 40°47′N 89°46′W / 40.79°N 89.76°W | |
| Country | |
| State | |
| Founded | 1825 |
| Named after | Peoria tribe |
| Seat | Peoria |
| Largest city | Peoria |
| Area | |
• Total | 631 sq mi (1,630 km2) |
| • Land | 619 sq mi (1,600 km2) |
| • Water | 11 sq mi (28 km2) 1.8% |
| Population (2020) | |
• Total | 181,830 |
• Estimate (2024) | 179,630 |
| • Density | 294/sq mi (113/km2) |
| Time zone | UTC−6 (Central) |
| • Summer (DST) | UTC−5 (CDT) |
| ZIP Codes | 61451, 61517, 61523, 61525, 61526, 61528, 61529, 61531, 61533, 61536, 61539, 61547, 61552, 61559, 61562, 61569, 61601, 61602, 61603, 61604, 61605, 61606, 61607, 61612, 61613, 61614, 61615, 61616, 61625, 61629, 61630, 61633, 61634, 61636, 61637, 61638, 61639, 61641, 61643, 61650, 61651, 61652, 61653, 61654, 61655, 61656 |
| Congressional districts | 16th, 17th |
| Website | www |
Peoria County is located in the U.S. state of Illinois. The 2020 United States census listed its population at 181,830.[2] Its county seat is Peoria.[3] Peoria County is part of the Peoria metropolitan area.
History
Peoria County was formed in 1825 out of Fulton County. It was named for the Peoria, an Illiniwek people who lived there. It included most of the western valley of the Illinois River up to the Chicago river portage.
Geography
According to the US Census Bureau, the county has a total area of 631 square miles (1,630 km2), of which 619 square miles (1,600 km2) is land and 11 square miles (28 km2) (1.8%) is water.[4] The county is drained by Spoon River, Kickapoo Creek, Elbow Creek, and Copperas Creek.[5]
Climate and weather
| Peoria, Illinois | ||||||||||||||||||||||||||||||||||||||||||||||||||||||||||||
|---|---|---|---|---|---|---|---|---|---|---|---|---|---|---|---|---|---|---|---|---|---|---|---|---|---|---|---|---|---|---|---|---|---|---|---|---|---|---|---|---|---|---|---|---|---|---|---|---|---|---|---|---|---|---|---|---|---|---|---|---|
| Climate chart (explanation) | ||||||||||||||||||||||||||||||||||||||||||||||||||||||||||||
| ||||||||||||||||||||||||||||||||||||||||||||||||||||||||||||
| ||||||||||||||||||||||||||||||||||||||||||||||||||||||||||||
In recent years, average temperatures in the county seat of Peoria have ranged from a low of 14 °F (−10 °C) in January to a high of 86 °F (30 °C) in July, although a record low of −27 °F (−33 °C) was recorded in January 1884 and a record high of 113 °F (45 °C) was recorded in July 1936. Average monthly precipitation ranged from 1.50 inches (38 mm) in January to 4.17 inches (106 mm) in May.[6]
Adjacent counties
- Knox County – northwest
- Stark County – north
- Marshall County – northeast
- Woodford County – east
- Tazewell County – south
- Fulton County – southwest
Transportation
Transit
- Greater Peoria Mass Transit District
- Burlington Trailways
- Peoria Charter Coach Company
- List of intercity bus stops in Illinois
Major highways
Defunct highways
Airports
- General Wayne A. Downing Peoria International Airport (PIA), formerly Greater Peoria Regional Airport
- Mount Hawley Auxiliary Airport (3MY) – Peoria, Illinois[7]
Demographics
| Census | Pop. | Note | %± |
|---|---|---|---|
| 1840 | 6,153 | — | |
| 1850 | 17,547 | 185.2% | |
| 1860 | 36,601 | 108.6% | |
| 1870 | 47,540 | 29.9% | |
| 1880 | 55,355 | 16.4% | |
| 1890 | 70,378 | 27.1% | |
| 1900 | 88,608 | 25.9% | |
| 1910 | 100,255 | 13.1% | |
| 1920 | 111,710 | 11.4% | |
| 1930 | 141,344 | 26.5% | |
| 1940 | 153,374 | 8.5% | |
| 1950 | 174,347 | 13.7% | |
| 1960 | 189,044 | 8.4% | |
| 1970 | 195,318 | 3.3% | |
| 1980 | 200,466 | 2.6% | |
| 1990 | 182,827 | −8.8% | |
| 2000 | 183,433 | 0.3% | |
| 2010 | 186,494 | 1.7% | |
| 2020 | 181,830 | −2.5% | |
| 2024 (est.) | 179,630 | [8] | −1.2% |
| US Decennial Census[9] 1790–1960[10] 1900–1990[11] 1990–2000[12] 2010–2019[2] | |||
2020 census
As of the 2020 census, the county had a population of 181,830. The median age was 38.5 years; 23.2% of residents were under the age of 18 and 17.9% of residents were 65 years of age or older. For every 100 females there were 95.4 males, and for every 100 females age 18 and over there were 92.2 males age 18 and over.[13]
The racial makeup of the county was 67.4% White, 18.7% Black or African American, 0.3% American Indian and Alaska Native, 4.3% Asian, <0.1% Native Hawaiian and Pacific Islander, 2.8% from some other race, and 6.5% from two or more races. Hispanic or Latino residents of any race comprised 5.5% of the population.[14]
83.1% of residents lived in urban areas, while 16.9% lived in rural areas.[15]
There were 75,808 households in the county, of which 28.1% had children under the age of 18 living in them. Of all households, 40.9% were married-couple households, 21.0% were households with a male householder and no spouse or partner present, and 31.1% were households with a female householder and no spouse or partner present. About 33.8% of all households were made up of individuals and 12.8% had someone living alone who was 65 years of age or older.[13]
There were 85,074 housing units, of which 10.9% were vacant. Among occupied housing units, 63.3% were owner-occupied and 36.7% were renter-occupied. The homeowner vacancy rate was 2.8% and the rental vacancy rate was 12.5%.[13]
Racial and ethnic composition
| Race / Ethnicity (NH = Non-Hispanic) | Pop 1980[16] | Pop 1990[17] | Pop 2000[18] | Pop 2010[19] | Pop 2020[20] | % 1980 | % 1990 | % 2000 | % 2010 | % 2020 |
|---|---|---|---|---|---|---|---|---|---|---|
| White alone (NH) | 174,586 | 152,801 | 143,932 | 135,620 | 120,629 | 87.09% | 83.58% | 78.47% | 72.72% | 66.34% |
| Black or African American alone (NH) | 21,349 | 24,746 | 29,320 | 32,720 | 33,635 | 10.65% | 13.54% | 15.98% | 17.54% | 18.50% |
| Native American or Alaska Native alone (NH) | 275 | 303 | 365 | 373 | 342 | 0.14% | 0.17% | 0.20% | 0.20% | 0.19% |
| Asian alone (NH) | 1,322 | 2,193 | 3,010 | 5,819 | 7,730 | 0.66% | 1.20% | 1.64% | 3.12% | 4.25% |
| Native Hawaiian or Pacific Islander alone (NH) | x [21] | x [22] | 39 | 59 | 61 | x | x | 0.02% | 0.03% | 0.03% |
| Other race alone (NH) | 462 | 188 | 288 | 314 | 783 | 0.23% | 0.10% | 0.16% | 0.17% | 0.43% |
| Mixed race or Multiracial (NH) | x [23] | x [24] | 2,652 | 4,487 | 8,559 | x | x | 1.45% | 2.41% | 4.71% |
| Hispanic or Latino (any race) | 2,472 | 2,596 | 3,827 | 7,102 | 10,091 | 1.23% | 1.42% | 2.09% | 3.81% | 5.55% |
| Total | 200,466 | 182,827 | 183,433 | 186,494 | 181,830 | 100.00% | 100.00% | 100.00% | 100.00% | 100.00% |
2010 census
In terms of ancestry, per the 2010 US Census, 28.3% were German, 14.8% were Irish, 10.4% were English, and 5.5% were American.[25]
Of the 75,793 households, 30.5% had children under the age of 18 living with them, 44.1% were married couples living together, 14.1% had a female householder with no husband present, 37.7% were non-families, and 31.0% of all households were made up of individuals. The average household size was 2.39 and the average family size was 3.00. The median age was 36.8 years.[26]
The median income for a household in the county was $49,747 and the median income for a family was $63,163. Males had a median income of $51,246 versus $32,881 for females. The per capita income for the county was $28,157. About 10.3% of families and 14.5% of the population were below the poverty line, including 21.8% of those under age 18 and 7.8% of those age 65 or over.[27]
Points of interest
- Glasford crater
- Jubilee College State Park
- WMBD World's Most Beautiful Drive (Grandview Drive/Prospect)[28]
- Forest Park Nature Center[29]
- Peoria Heights Tower Park[30]
- Rock Island Trail
Communities
Cities
Villages
Census-designated places
Unincorporated communities
Townships
The cities of Peoria and West Peoria are considered independent from all of the townships within this county.
- Brimfield
- Chillicothe
- Elmwood
- Kickapoo
- Princeville
- Trivoli
- West Peoria (former, now defunct and part of West Peoria)
School districts
Notable residents
People from Peoria County other than in the city of Peoria:
- Chris Brackett, host of Arrow Affliction on The Sportsman Channel
- Mike Dunne, pitcher for several Major League Baseball teams
- Mary Emma Holmes (1839-1937), reformer, suffragist, and educator
- Bill Krieg, Major League Baseball player
- Lance (Henry) LeGault, TV and movie actor: Colonel Roderick Decker on The A-Team
- Zach McAllister, Major League Baseball player: Cleveland Indians pitcher
- Johnston McCulley, pulp fiction author: creator of Zorro
- Richard Pryor, Actor, Comedian
- David Ogden Stiers, actor, Major Charles Emerson Winchester III on M*A*S*H
- Josh Taylor, TV actor: Chris Kostichek on the soap opera Days of Our Lives
- Jim Thome, first baseman for several Major League Baseball teams
Government
Peoria County is governed by an 18-member County Board which meets on the second Thursday of each month. Each member represents a district with roughly 10,000 residents.[31]
| District | Board Member | Residence | In office since | Party |
|---|---|---|---|---|
| 1 | Sharon K. Williams | Peoria | 2012 | Democratic |
| 2 | Camille Coates | Peoria | 2022 | Democratic |
| 3 | Betty Duncan | Peoria | 2020 | Democratic |
| 4 | Brandy Bryant | Peoria | 2019 | Democratic |
| 5 | James C. Dillon (Chair) | West Peoria | 2006 | Democratic |
| 6 | Dr. Eden Blair | Peoria | 2019 | Democratic |
| 7 | Phillip Salzer | Peoria | unknown | Democratic |
| 8 | Nathan Hoerr | Peoria | 2022 | Republican |
| 9 | Danny Phelan | Peoria Heights | 2022 | Democratic |
| 10 | Rob Reneau | Peoria | 2018 | Democratic |
| 11 | Linda E. Daley | Peoria | 2019 | Republican |
| 12 | Daniel Kelch | Edwards | 2022 | Republican |
| 13 | Terry Ruthland | Chillicothe | 2022 | Republican |
| 14 | Brian Elsasser | Princeville | 1998 | Republican |
| 15 | Steven B. Rieker | Peoria | 2016 | Republican |
| 16 | Matt Windish | Brimfield | 2018 | Republican |
| 17 | Jennifer Groves Allison | Peoria | 2019 | Democratic |
| 18 | Paul Rosenbohm | Peoria | 2010 | Republican |
The County also elects an Auditor, Circuit Clerk, Coroner, County Clerk, Sheriff, State's Attorney, Regional Superintendent (Education), and Treasurer to four-year terms.
| Office | Current Holder | In office since | Party |
|---|---|---|---|
| Auditor | Jessica Thomas | 2018 | Democratic |
| Circuit Clerk | Bobby Spears | 2002 | Democratic |
| Coroner | Jamie Harwood | 2016 | Democratic |
| County Clerk | Rachael Parker | 2019 | Democratic |
| Sheriff | Chris Watkins | 2022 | Republican |
| State's Attorney | Jodi Hoos | 2019 | Democratic |
| Regional Superintendent | Elizabeth Crider | 2014 | Democratic |
| Treasurer | Nicole Bjerke | 2017 | Republican |
Politics
| Year | Republican | Democratic | Third party(ies) | |||
|---|---|---|---|---|---|---|
| № | % | № | % | № | % | |
| 1892 | 7,266 | 45.63% | 8,053 | 50.57% | 605 | 3.80% |
| 1896 | 10,486 | 52.70% | 9,068 | 45.57% | 344 | 1.73% |
| 1900 | 10,700 | 51.82% | 9,433 | 45.69% | 514 | 2.49% |
| 1904 | 11,868 | 62.02% | 5,697 | 29.77% | 1,570 | 8.20% |
| 1908 | 10,828 | 52.47% | 8,898 | 43.12% | 909 | 4.41% |
| 1912 | 9,229 | 41.91% | 8,364 | 37.98% | 4,427 | 20.10% |
| 1916 | 18,615 | 48.38% | 18,718 | 48.65% | 1,145 | 2.98% |
| 1920 | 24,541 | 66.00% | 9,453 | 25.42% | 3,188 | 8.57% |
| 1924 | 25,243 | 58.55% | 6,343 | 14.71% | 11,526 | 26.74% |
| 1928 | 31,024 | 56.50% | 23,150 | 42.16% | 739 | 1.35% |
| 1932 | 25,166 | 39.50% | 37,605 | 59.02% | 945 | 1.48% |
| 1936 | 25,425 | 33.96% | 48,063 | 64.20% | 1,377 | 1.84% |
| 1940 | 34,911 | 45.21% | 42,009 | 54.40% | 301 | 0.39% |
| 1944 | 34,171 | 50.81% | 32,837 | 48.83% | 243 | 0.36% |
| 1948 | 35,018 | 52.78% | 31,026 | 46.76% | 308 | 0.46% |
| 1952 | 49,245 | 59.09% | 33,955 | 40.74% | 139 | 0.17% |
| 1956 | 50,888 | 62.72% | 30,145 | 37.15% | 108 | 0.13% |
| 1960 | 45,529 | 53.77% | 39,061 | 46.13% | 86 | 0.10% |
| 1964 | 33,327 | 41.30% | 47,360 | 58.70% | 0 | 0.00% |
| 1968 | 37,021 | 49.96% | 30,937 | 41.75% | 6,147 | 8.29% |
| 1972 | 50,324 | 64.49% | 27,264 | 34.94% | 444 | 0.57% |
| 1976 | 46,526 | 56.65% | 34,606 | 42.14% | 991 | 1.21% |
| 1980 | 47,815 | 57.26% | 28,276 | 33.86% | 7,419 | 8.88% |
| 1984 | 45,607 | 55.02% | 36,830 | 44.43% | 462 | 0.56% |
| 1988 | 37,605 | 51.35% | 35,253 | 48.14% | 372 | 0.51% |
| 1992 | 30,718 | 37.77% | 38,099 | 46.85% | 12,511 | 15.38% |
| 1996 | 30,990 | 41.82% | 37,383 | 50.45% | 5,729 | 7.73% |
| 2000 | 36,398 | 47.39% | 38,604 | 50.26% | 1,810 | 2.36% |
| 2004 | 41,051 | 49.60% | 41,121 | 49.68% | 599 | 0.72% |
| 2008 | 34,579 | 42.32% | 45,906 | 56.19% | 1,219 | 1.49% |
| 2012 | 36,774 | 46.90% | 40,209 | 51.28% | 1,428 | 1.82% |
| 2016 | 35,633 | 45.05% | 38,060 | 48.12% | 5,409 | 6.84% |
| 2020 | 38,252 | 45.55% | 43,578 | 51.90% | 2,143 | 2.55% |
| 2024 | 36,896 | 46.28% | 40,564 | 50.88% | 2,262 | 2.84% |
Prior to 1992, Peoria County, like most of central Illinois, was overwhelmingly Republican. Usually, it only voted for Democratic Party presidential candidates when they won nationally by a landslide. It began trending away from the GOP in the mid-1980s, as evidenced when Ronald Reagan only carried it with 55 percent of the vote in 1984 even as he was winning reelection in a landslide nationally.
From 1992 onward, the county has backed the Democratic candidate in every presidential election, though never by a margin greater than 10 percent aside from 2008 when Illinoisan Barack Obama won it by nearly 14 points. This relative closeness in results was most evident in 2004 when the county backed John Kerry over George W. Bush by only 70 votes.
In Congress, Peoria County is represented by Democrat Eric Sorensen of Illinois's 17th congressional district and Republican Darin LaHood of the Illinois's 18th congressional district.
In the Illinois Senate, Peoria County is represented by Republican Win Stoller of the 37th Legislative District and Democrat Dave Koehler of the 46th Legislative District. In the Illinois House of Representatives, Peoria County is represented by Republican Ryan Spain of the 73rd Representative District, Republican Travis Weaver of the 91st Representative District and Democrat Jehan Gordon-Booth of the 92nd Representative District.
Education
K-12 school districts include:[33]
- Brimfield Community Unit School District 309
- Dunlap Community Unit School District 323
- Elmwood Community Unit School District 322
- Farmington Central Community Unit School District 265
- Illini Bluffs Community Unit School District 327
- Illinois Valley Central Unit School District 321
- Peoria School District 150
- Peoria Heights Community Unit School District 325
- Princeville Community Unit School District 326
- Stark County Community Unit School District 100
- Williamsfield Community Unit School District 210
Secondary school districts include:[33]
Elementary school districts include:[33]
- Bartonville School District 66
- Hollis Consolidated School District 328
- Limestone Walters Community Consolidated School District 316
- Monroe School District 70
- Norwood Elementary School District 63
- Oak Grove School District 68
- Pleasant Hill School District 69
- Pleasant Valley School District 62
See also
References
- ^ "County Population Totals and Components of Change: 2020–2024". United States Census Bureau. U.S. Department of Commerce. March 2025. Retrieved August 31, 2025.
- ^ a b "QuickFacts Peoria County, Illinois". United States Census. US Census Bureau.
- ^ "Peoria County, Illinois".
- ^ "Population, Housing Units, Area, and Density: 2010 – County". US Census Bureau. Archived from the original on February 12, 2020. Retrieved July 12, 2015.
- ^ Ripley, George; Dana, Charles A., eds. (1879). . The American Cyclopædia.
- ^ a b "Monthly Averages for Peoria IL". The Weather Channel. Retrieved January 27, 2011.
- ^ "Peoria County Public and Private Airports". www.tollfreeairline.com. Retrieved April 17, 2018.
- ^ "Population and Housing Unit Estimates Tables". United States Census Bureau. Retrieved July 24, 2025.
- ^ "US Decennial Census". US Census Bureau. Retrieved July 8, 2014.
- ^ "Historical Census Browser". University of Virginia Library. Archived from the original on August 11, 2012. Retrieved July 8, 2014.
- ^ "Population of Counties by Decennial Census: 1900 to 1990". US Census Bureau. Retrieved July 8, 2014.
- ^ "Census 2000 PHC-T-4. Ranking Tables for Counties: 1990 and 2000" (PDF). US Census Bureau. Retrieved July 8, 2014.
- ^ a b c "2020 Decennial Census Demographic Profile (DP1)". United States Census Bureau. 2021. Retrieved December 25, 2025.
- ^ "2020 Decennial Census Redistricting Data (Public Law 94-171)". United States Census Bureau. 2021. Retrieved December 25, 2025.
- ^ "2020 Decennial Census Demographic and Housing Characteristics (DHC)". United States Census Bureau. 2023. Retrieved December 25, 2025.
- ^ "1980 Census of Population - General Population Characteristics - Illinois- Table 14 - Persons by Race and Table 16 (p. 18-28) - Total Persons and Spanish Origin Persons by Type of Spanish Origin and Race (p. 29-39)" (PDF). United States Census Bureau.
- ^ "1990 Census of Population - General Population Characteristics - Illinois - Table 6 - Race and Hispanic Orogin" (PDF). United States Census Bureau.
- ^ "P004: Hispanic or Latino, and Not Hispanic or Latino by Race – 2000: DEC Summary File 1 – Peoria County, Illinois". United States Census Bureau.
- ^ "P2: Hispanic or Latino, and Not Hispanic or Latino by Race – 2010: DEC Redistricting Data (PL 94-171) – Peoria County, Illinois". United States Census Bureau.
- ^ "P2: Hispanic or Latino, and Not Hispanic or Latino by Race – 2020: DEC Redistricting Data (PL 94-171) – Peoria County, Illinois". United States Census Bureau.
- ^ included in the Asian category in the 1980 Census
- ^ included in the Asian category in the 1990 Census
- ^ not an option in the 1980 Census
- ^ not an option in the 1990 Census
- ^ "Selected Social Characteristics in the United States – 2006–2010 American Community Survey 5-Year Estimates". US Census Bureau. Archived from the original on February 13, 2020. Retrieved July 12, 2015.
- ^ "Profile of General Population and Housing Characteristics: 2010 Demographic Profile Data". US Census Bureau. Archived from the original on February 13, 2020. Retrieved July 12, 2015.
- ^ "Selected Economic Characteristics – 2006–2010 American Community Survey 5-Year Estimates". US Census Bureau. Archived from the original on February 13, 2020. Retrieved July 12, 2015.
- ^ Grandview Drive Google Maps (accessed 27 December 2018)
- ^ Forest Park Nature Center Google Maps (accessed 27 December 2018)
- ^ Peoria Heights Tower Park Google Maps (accessed 27 December 2018)
- ^ "County Board | Peoria County, IL". www.peoriacounty.org. Retrieved October 8, 2019.
- ^ Leip, David. "Atlas of US Presidential Elections". uselectionatlas.org. Retrieved April 17, 2018.
- ^ a b c "2020 CENSUS - SCHOOL DISTRICT REFERENCE MAP: Peoria County, IL" (PDF). U.S. Census Bureau. Retrieved October 30, 2024. - Text list
External links
Places adjacent to Peoria County, Illinois | ||||||||||||||||
|---|---|---|---|---|---|---|---|---|---|---|---|---|---|---|---|---|
| ||||||||||||||||
Municipalities and communities of Peoria County, Illinois, United States | ||
|---|---|---|
| Cities | 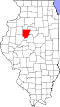 | |
| Villages | ||
| Townships | ||
| CDPs | ||
| Other communities | ||
| Footnotes | ‡This populated place also has portions in an adjacent county or counties | |
| International | |
|---|---|
| National | |
| Other | |