


Marshall County, Iowa
Marshall County, Iowa | |
|---|---|
 The courthouse in Marshalltown is on the NRHP | |
 Location within the U.S. state of Iowa | |
| Coordinates: 42°02′30″N 92°58′53″W / 42.041700°N 92.981403°W | |
| Country | |
| State | |
| Founded | January 13, 1846 |
| Named after | John Marshall |
| Seat | Marshalltown |
| Largest city | Marshalltown |
| Area | |
• Total | 573.199 sq mi (1,484.58 km2) |
| • Land | 572.503 sq mi (1,482.78 km2) |
| • Water | 0.696 sq mi (1.80 km2) 0.12% |
| Population (2020) | |
• Total | 40,105 |
• Estimate (2024) | 40,392 |
| • Density | 70.052/sq mi (27.047/km2) |
| Time zone | UTC−6 (Central) |
| • Summer (DST) | UTC−5 (CDT) |
| Area code | 641 |
| Congressional district | 1st |
| Website | marshallcountyia.gov |
| |
Marshall County is a county located in the U.S. state of Iowa. As of the 2020 census, the population was 40,105,[2] and was estimated to be 40,392 in 2024.[3] The county seat and largest city is Marshalltown.[4] The county was formed on January 13, 1846, and named after John Marshall, Chief Justice of the United States Supreme Court.[5] Marshall County comprises the Marshalltown, Iowa Micropolitan Statistical Area. In 2010, the center of population of Iowa was located in Marshall County, near Melbourne.[6]
Geography
According to the United States Census Bureau, the county has a total area of 573.199 square miles (1,484.58 km2), of which 572.503 square miles (1,482.78 km2) is land and 0.696 square miles (1.80 km2) (0.12%) is water.[7] It is the 43rd largest county in Iowa by total area.[8]
Transit
Major highways
Adjacent counties
- Jasper County (South)
- Tama County (East)
- Story County (West)
- Hardin County (Northwest)
- Grundy County (North)
Demographics
| Census | Pop. | Note | %± |
|---|---|---|---|
| 1850 | 338 | — | |
| 1860 | 6,015 | 1,679.6% | |
| 1870 | 17,576 | 192.2% | |
| 1880 | 23,752 | 35.1% | |
| 1890 | 25,842 | 8.8% | |
| 1900 | 29,991 | 16.1% | |
| 1910 | 30,279 | 1.0% | |
| 1920 | 32,630 | 7.8% | |
| 1930 | 33,727 | 3.4% | |
| 1940 | 35,406 | 5.0% | |
| 1950 | 35,611 | 0.6% | |
| 1960 | 37,984 | 6.7% | |
| 1970 | 41,076 | 8.1% | |
| 1980 | 41,652 | 1.4% | |
| 1990 | 38,276 | −8.1% | |
| 2000 | 39,311 | 2.7% | |
| 2010 | 40,648 | 3.4% | |
| 2020 | 40,105 | −1.3% | |
| 2024 (est.) | 40,392 | [9] | 0.7% |
| U.S. Decennial Census[10] 1790–1960[11] 1900–1990[12] 1990–2000[13] 2010–2020[3] | |||

Housing market
As of the second quarter of 2025, the median home value in Marshall County was $150,876.[14]
American Community Survey
As of the 2024 American Community Survey, households averaged 2.48 persons per household. The county's median household income was $72,785, approximately 11.1% of residents lived at or below the poverty line, the estimated employment rate was 63.9%, 21.4% of residents held a bachelor's degree or higher, and 87.0% had at least a high school diploma.[3]
Racial and ethnic composition
| Race / ethnicity (NH = non-Hispanic) | Pop. 1980[15] | Pop. 1990[16] | Pop. 2000[17] | Pop. 2010[18] | Pop. 2020[19] |
|---|---|---|---|---|---|
| White alone (NH) | 40,739 (97.81%) |
37,308 (97.47%) |
34,640 (88.12%) |
31,807 (78.25%) |
27,438 (68.42%) |
| Black or African American alone (NH) | 266 (0.64%) |
278 (0.73%) |
348 (0.89%) |
629 (1.55%) |
785 (1.96%) |
| Native American or Alaska Native alone (NH) | 75 (0.18%) |
94 (0.25%) |
127 (0.32%) |
104 (0.26%) |
153 (0.38%) |
| Asian alone (NH) | 163 (0.39%) |
294 (0.77%) |
307 (0.78%) |
526 (1.29%) |
1,514 (3.78%) |
| Pacific Islander alone (NH) | — | — | 17 (0.04%) |
39 (0.10%) |
33 (0.08%) |
| Other race alone (NH) | 135 (0.32%) |
10 (0.03%) |
35 (0.09%) |
33 (0.08%) |
59 (0.15%) |
| Mixed race or multiracial (NH) | — | — | 314 (0.80%) |
493 (1.21%) |
983 (2.45%) |
| Hispanic or Latino (any race) | 274 (0.66%) |
292 (0.76%) |
3,523 (8.96%) |
7,017 (17.26%) |
9,140 (22.79%) |
| Total | 41,652 (100.00%) |
38,276 (100.00%) |
39,311 (100.00%) |
40,648 (100.00%) |
40,105 (100.00%) |
2020 census
As of the 2020 census, there were 40,105 people, 15,358 households, and 10,161 families residing in the county.[20] The median age was 39.2 years, 25.2% of residents were under the age of 18, and 19.3% were 65 years of age or older. For every 100 females there were 102.4 males, and for every 100 females age 18 and over there were 101.6 males age 18 and over.[21]
The racial makeup of the county was 73.8% White, 2.0% Black or African American, 0.8% American Indian and Alaska Native, 3.8% Asian, 0.1% Native Hawaiian and Pacific Islander, 10.3% from some other race, and 9.2% from two or more races. Hispanic or Latino residents of any race comprised 22.8% of the population.[22]
68.3% of residents lived in urban areas, while 31.7% lived in rural areas.[23]
There were 15,358 households in the county, of which 31.3% had children under the age of 18 living in them. Of all households, 50.3% were married-couple households, 18.9% were households with a male householder and no spouse or partner present, and 24.1% were households with a female householder and no spouse or partner present. About 28.6% of all households were made up of individuals and 13.5% had someone living alone who was 65 years of age or older.[21]
There were 16,745 housing units at an average density of 29.25 per square mile (11.3/km2); 8.3% were vacant. Among occupied housing units, 72.3% were owner-occupied and 27.7% were renter-occupied. The homeowner vacancy rate was 1.3% and the rental vacancy rate was 10.3%.[21]
2010 census
As of the 2010 census, there were 40,648 people, 15,538 households, and _ families residing in the county. The population density was 71.00 inhabitants per square mile (27.4/km2). There were 16,831 housing units at an average density of 29.40 per square mile (11.4/km2). The racial makeup of the county was 88.74% White, 1.67% African American, 0.46% Native American, 1.32% Asian, 0.12% Pacific Islander, 5.65% from some other races and 2.04% from two or more races. Hispanic or Latino people of any race were 17.26% of the population.
2000 census
As of the 2000 census, there were 39,311 people, 15,338 households, and 10,460 families residing in the county. The population density was 68.67 inhabitants per square mile (26.5/km2). There were 16,324 housing units at an average density of 28.51 per square mile (11.0/km2). The racial makeup of the county was 90.44% White, 0.93% African American, 0.35% Native American, 0.78% Asian, 0.06% Pacific Islander, 6.03% from some other races and 1.42% from two or more races. Hispanic or Latino people of any race were 8.96% of the population.
There were 15,338 households 31.10% had children under the age of 18 living with them, 55.40% were married couples living together, 9.30% had a female householder with no husband present, and 31.80% were non-families. 26.90% of households were one person and 12.20% were one person aged 65 or older. The average household size was 2.48 and the average family size was 3.00.
The age distribution was 25.30% under the age of 18, 8.10% from 18 to 24, 26.30% from 25 to 44, 23.90% from 45 to 64, and 16.40% 65 or older. The median age was 39 years. For every 100 females there were 99.20 males. For every 100 females age 18 and over, there were 96.50 males.
The median household income was $38,268 and the median family income was $46,627. Males had a median income of $33,809 versus $24,063 for females. The per capita income for the county was $19,176. About 7.10% of families and 10.20% of the population were below the poverty line, including 14.30% of those under age 18 and 8.60% of those age 65 or over.
Communities
Cities
- Albion
- Clemons
- Ferguson
- Gilman
- Haverhill
- Laurel
- Le Grand
- Liscomb
- Marshalltown
- Melbourne
- Rhodes (previously named Edenville)[24]
- St. Anthony
- State Center
Census-designated place
Other unincorporated communities
Townships
Population ranking
The population ranking of the following table is based on the 2020 census of Marshall County.
† county seat
| Rank | City/Town/etc. | Municipal type | Population (2020 Census) | Population (2024 Estimate) |
|---|---|---|---|---|
| 1 | † Marshalltown | City | 27,591 | 27,886 |
| 2 | State Center | City | 1,391 | 1,403 |
| 3 | Le Grand (partially in Tama County) | City | 905 | 891 |
| 4 | Melbourne | City | 786 | 771 |
| 5 | Gilman | City | 542 | 530 |
| 6 | Albion | City | 448 | 444 |
| 7 | Liscomb | City | 291 | 292 |
| 8 | Rhodes | City | 271 | 269 |
| 9 | Laurel | City | 220 | 214 |
| 10 | Haverhill | City | 165 | 164 |
| 11 | Clemons | City | 140 | 135 |
| 12 | Green Mountain | CDP | 113 | 105 |
| 13 | Ferguson | City | 97 | 98 |
| 14 | St. Anthony | City | 76 | 77 |
Politics
Prior to 1964, Marshall County was strongly Republican, never backing a Democratic presidential candidate from 1880 to 1960 and only failing to back a Republican candidate during those years in 1912 with a strong third-party campaign by former president Theodore Roosevelt on the Bull Moose ticket. Since then, it has become far more of a swing county, having backed the national winner in the seven presidential elections from 1992 to 2016. That streak was broken in 2020, when Donald Trump won the county but lost nationally. The county is considered a bellwether polity.[25]
| Year | Republican | Democratic | Third party(ies) | |||
|---|---|---|---|---|---|---|
| № | % | № | % | № | % | |
| 1896 | 4,541 | 61.85% | 2,626 | 35.77% | 175 | 2.38% |
| 1900 | 4,878 | 65.07% | 2,329 | 31.07% | 289 | 3.86% |
| 1904 | 4,229 | 66.74% | 1,203 | 18.98% | 905 | 14.28% |
| 1908 | 3,887 | 61.34% | 1,941 | 30.63% | 509 | 8.03% |
| 1912 | 926 | 13.79% | 2,162 | 32.19% | 3,629 | 54.03% |
| 1916 | 4,172 | 60.32% | 2,414 | 34.90% | 330 | 4.77% |
| 1920 | 9,334 | 79.10% | 2,166 | 18.36% | 300 | 2.54% |
| 1924 | 9,010 | 68.09% | 1,516 | 11.46% | 2,707 | 20.46% |
| 1928 | 9,326 | 72.90% | 3,384 | 26.45% | 82 | 0.64% |
| 1932 | 6,604 | 48.98% | 6,385 | 47.36% | 494 | 3.66% |
| 1936 | 7,377 | 52.66% | 6,297 | 44.95% | 334 | 2.38% |
| 1940 | 8,503 | 56.44% | 6,497 | 43.13% | 65 | 0.43% |
| 1944 | 7,325 | 55.67% | 5,598 | 42.55% | 234 | 1.78% |
| 1948 | 6,698 | 52.19% | 5,602 | 43.65% | 533 | 4.15% |
| 1952 | 11,135 | 65.93% | 5,314 | 31.46% | 441 | 2.61% |
| 1956 | 10,305 | 62.74% | 5,755 | 35.04% | 365 | 2.22% |
| 1960 | 10,265 | 60.23% | 6,761 | 39.67% | 16 | 0.09% |
| 1964 | 6,323 | 39.09% | 9,815 | 60.68% | 38 | 0.23% |
| 1968 | 9,402 | 56.35% | 6,362 | 38.13% | 922 | 5.53% |
| 1972 | 10,798 | 60.85% | 6,618 | 37.30% | 328 | 1.85% |
| 1976 | 9,562 | 51.33% | 8,695 | 46.67% | 373 | 2.00% |
| 1980 | 10,707 | 54.56% | 7,114 | 36.25% | 1,805 | 9.20% |
| 1984 | 10,839 | 54.63% | 8,809 | 44.40% | 192 | 0.97% |
| 1988 | 7,657 | 43.63% | 9,760 | 55.62% | 132 | 0.75% |
| 1992 | 6,784 | 37.09% | 8,303 | 45.40% | 3,202 | 17.51% |
| 1996 | 7,017 | 40.50% | 8,669 | 50.04% | 1,638 | 9.46% |
| 2000 | 8,785 | 49.85% | 8,322 | 47.22% | 517 | 2.93% |
| 2004 | 9,557 | 49.87% | 9,443 | 49.27% | 164 | 0.86% |
| 2008 | 8,278 | 44.36% | 10,023 | 53.71% | 362 | 1.94% |
| 2012 | 8,472 | 44.44% | 10,257 | 53.80% | 335 | 1.76% |
| 2016 | 9,146 | 50.87% | 7,652 | 42.56% | 1,182 | 6.57% |
| 2020 | 9,571 | 52.77% | 8,176 | 45.08% | 389 | 2.14% |
| 2024 | 9,815 | 56.83% | 7,134 | 41.31% | 321 | 1.86% |
See also
References
- ^ "Iowa County Names and Numbers". Iowa Department of Administrative Services. Retrieved December 19, 2025.
- ^ "Explore Census Data". United States Census Bureau. Retrieved December 19, 2025.
- ^ a b c "U.S. Census Bureau QuickFacts: Marshall County, Iowa". www.census.gov. Retrieved December 19, 2025.
- ^ "Find a County". National Association of Counties. Retrieved December 19, 2025.
- ^ "Courthouse History—Marshall County, Iowa". Archived from the original on October 29, 2018. Retrieved January 20, 2008.
- ^ "Centers of Population by State: 2010". United States Census Bureau. Retrieved July 20, 2014.
- ^ "2025 County Gazetteer Files – Iowa". United States Census Bureau. Retrieved December 19, 2025.
- ^ "U.S. Census Bureau QuickFacts: Marshall County, Iowa". www.census.gov. Retrieved December 19, 2025.
- ^ "County Population Totals and Components of Change: 2020-2024". Retrieved December 19, 2025.
- ^ "U.S. Decennial Census". United States Census Bureau. Retrieved January 7, 2014.
- ^ "Historical Census Browser". University of Virginia Library. 2007. Archived from the original on December 12, 2009. Retrieved January 7, 2014.
- ^ Forstall, Richard L. (April 20, 1995). "Population of Counties by Decennial Census: 1900 to 1990". United States Census Bureau. Archived from the original on February 19, 1999. Retrieved January 7, 2014.
- ^ "Census 2000 PHC-T-4. Ranking Tables for Counties: 1990 and 2000" (PDF). United States Census Bureau. Archived (PDF) from the original on March 27, 2010. Retrieved January 7, 2014.
- ^ "County Median Home Price". National Association of Realtors. Retrieved December 19, 2025.
- ^ "Marshall County, Iowa — Population by Race". CensusScope. Retrieved December 19, 2025.
- ^ "1990 Census of Population: General Population Characteristics Washington" (PDF). www.census.gov. October 6, 2022. p. 30. Retrieved December 19, 2025.
- ^ "P004: Hispanic or Latino, and Not Hispanic or Latino by Race – 2000: DEC Summary File 1 – Marshall County, Iowa". United States Census Bureau. Retrieved December 19, 2025.
- ^ "P2: Hispanic or Latino, and Not Hispanic or Latino by Race – 2010: DEC Redistricting Data (PL 94-171) – Marshall County, Iowa". United States Census Bureau. Retrieved December 19, 2025.
- ^ "P2: Hispanic or Latino, and Not Hispanic or Latino by Race – 2020: DEC Redistricting Data (PL 94-171) – Marshall County, Iowa". United States Census Bureau. Retrieved December 19, 2025.
- ^ "U.S. Census Bureau, Table P16: Household Type". United States Census Bureau. Retrieved December 19, 2025.
- ^ a b c "2020 Decennial Census Demographic Profile (DP1)". United States Census Bureau. 2021. Retrieved December 25, 2025.
- ^ "2020 Decennial Census Redistricting Data (Public Law 94-171)". United States Census Bureau. 2021. Retrieved December 25, 2025.
- ^ "2020 Decennial Census Demographic and Housing Characteristics (DHC)". United States Census Bureau. 2023. Retrieved December 25, 2025.
- ^ "RootsWeb.com Home Page". freepages.family.rootsweb.ancestry.com. Retrieved April 11, 2018.
- ^ Wasserman, David (October 6, 2020), "The 10 Bellwether Counties That Show How Trump Is in Serious Trouble", Nytimes.com
- ^ Leip, David. "Dave Leip's Atlas of U.S. Presidential Elections". uselectionatlas.org. Retrieved February 22, 2021.
External links
Places adjacent to Marshall County, Iowa | ||||||||||||||||
|---|---|---|---|---|---|---|---|---|---|---|---|---|---|---|---|---|
| ||||||||||||||||
Municipalities and communities of Marshall County, Iowa, United States | ||
|---|---|---|
| Cities | 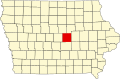 | |
| Townships | ||
| CDP | ||
| Other communities | ||
| Footnotes | ‡This populated place also has portions in an adjacent county or counties | |
| International | |
|---|---|
| National | |
| Other | |