


Size of this preview: 685 × 599 pixels. Other resolutions: 274 × 240 pixels | 549 × 480 pixels.
Original file (800 × 700 pixels, file size: 24 KB, MIME type: image/png)
Summary
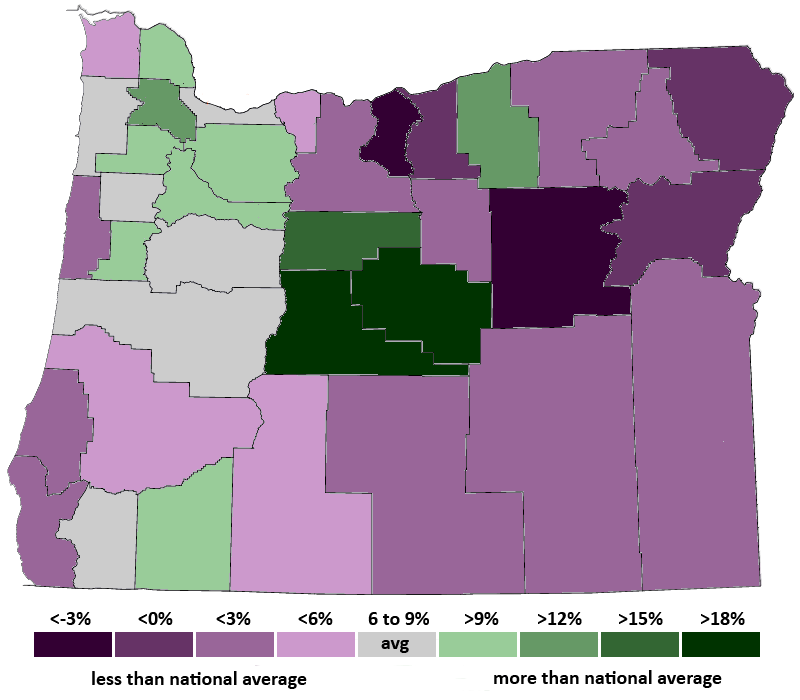
| Description | Oregon Population Growth by County, 2000-2007. Population growth in the green counties was higher than the national average, while growth in the purple counties was lower than the national average. Oregon's total population growth was 9.5%, compared with the national average of 7.7%. The fastest growing county was Deschutes at 39.4%. Leading the way in the Portland metro area was Washington County at 14.8%, followed by Clackamas at 10.0%, Yamhill at 9.5%, and Multnomah at 7.5%. | ||
| Date | |||
| Source | self-made using the state map at Image:Oregon counties.PNG and the 2007 Annual Population Report from the Portland State Population Research Center. | ||
| Author | Northwest-historian | ||
| Permission (Reusing this file) |
public domain | ||
| Other versions |
|

Licensing
| I, the copyright holder of this work, release this work into the public domain. This applies worldwide. In some countries this may not be legally possible; if so: I grant anyone the right to use this work for any purpose, without any conditions, unless such conditions are required by law. |
File history
Click on a date/time to view the file as it appeared at that time.
| Date/Time | Thumbnail | Dimensions | User | Comment | |
|---|---|---|---|---|---|
| current | 10:43, 3 April 2008 | | 800 × 700 (24 KB) | Northwest-historian | {{Information |Description=Oregon Population Growth by County, 2000-2007. Population growth in the green counties was higher than the national average, while growth in the purple counties was lower than the national average. Oregon's total population grow |
File usage
The following 6 pages use this file:
Global file usage
The following other wikis use this file:
- Usage on ja.wikipedia.org